FIGURE 6.
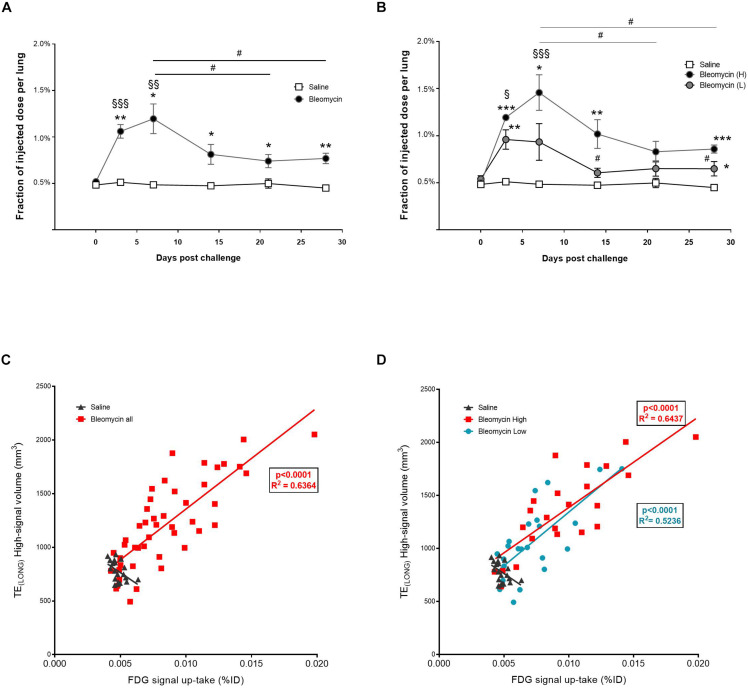
Quantification of PET-FDG signal up-take during inflammation and fibrosis. (A) Up-take of FDG-PET at different scan days, showed peak levels at inflammation (day 7), although does not return back to baseline values (saline) even though inflammation is not present during the fibrotic phase. Here the amount of animals was n = 4 in the saline group and n = 8 in the bleomycin group. (B) The signal peak of FDG-PET remains at day 7, also when presented according to the separated groups of high- and low-responders. Here the amount of animals was n = 4 in the saline group and n = 4 in each bleomycin group. Significance is indicated by * when p < 0.05; p < 0.01 by ** and p < 0.001 by ***, when comparing bleomycin towards the saline control from the same time point. The comparison of various time points between bleomycin-challenged groups is expressed as # when p < 0.05, while bleomycin group compared towards baseline (within the same group of animals), significance is indicated by § when p < 0.01; p < 0.01 by §§ and p < 0.001 by §§§. (C) PET signal up-take correlate with MRI signal (TELONG), presented within the whole bleomycin-challenged group. The red line in the graph is a linear fit to data from all animals, the R2 value is for this fit (R2 = 0.6364). (D) When presenting the separate groups of high- and low-responders, still significant correlation is observed. The red line in the graph is a linear fit to data from the high-responder group (R2 = 0.6437) while the blue line is linear fit to data from the low-responder group (R2 = 0.5236). For the statistical analysis, Spearman’s rank correlation was applied.

