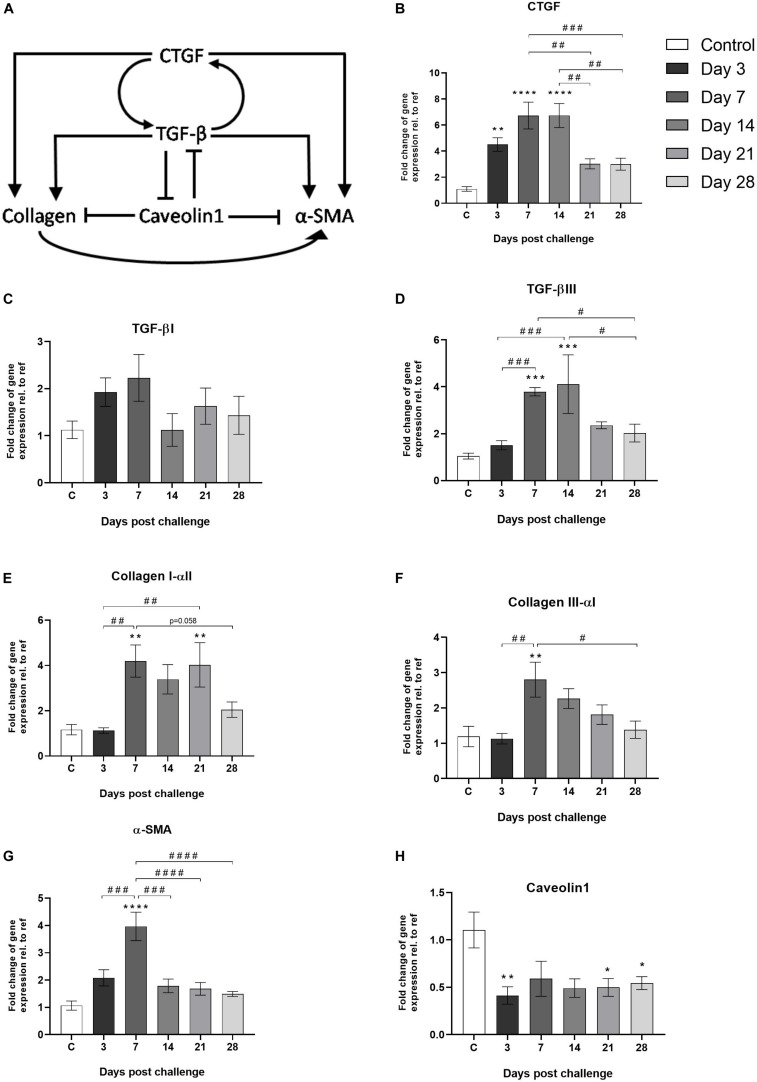
FIGURE 8.
Gene expression of markers known to be involved in the TFG-β/CTGF-axis. (A) Schematic image of the TGF-β/CTGF-axis involving markers known to be part of the fibrosis process in lung tissue (Wang et al., 2006; Lipson et al., 2012; Lin et al., 2013). Gene expression of (B) CTGF, (C) TGF-βI, (D) TGF-βIII, (E) Collagen I-αll and (F) Collagen llI-αl, (G) α-SMA, and (H) Caveolin1, are presented as mean ± standard error of the mean (SEM). All samples from the bleomycin group are related to the mean value of all control samples and normalized to the geometric mean of five reference genes. Each presented group/time point contains n = 4–8. Significance is indicated by ** when p < 0.01; p < 0.001 by *** and p < 0.0001 by ****, when comparing bleomycin towards the saline control. The comparison of various time points between bleomycin-challenged groups is expressed as # when p < 0.05; ## when p < 0.01; ### when p < 0.001 and #### when p < 0.0001.

