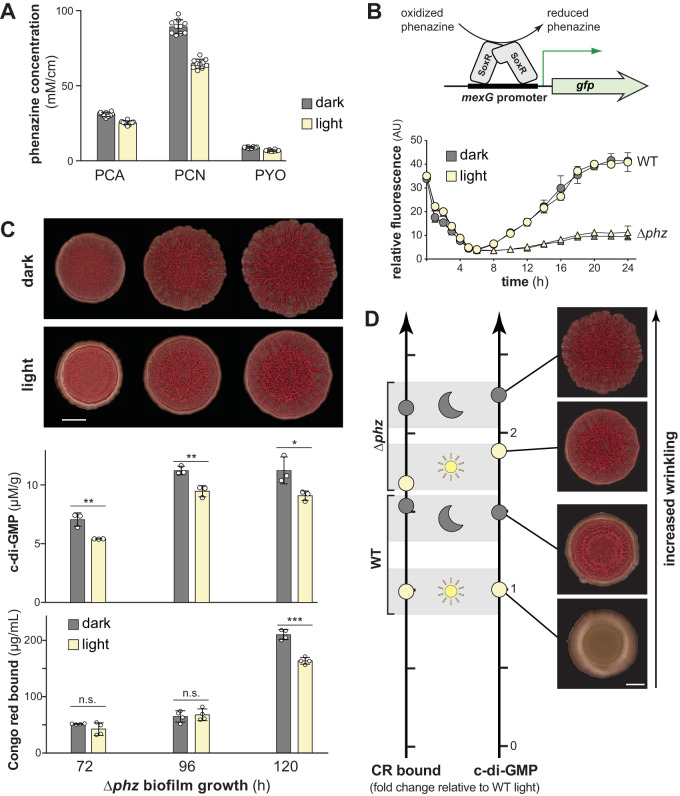
FIG 3.
Light does not increase phenazine production or oxidize the phenazine pool but does decrease c-di-GMP levels in the absence of phenazines. (A) Production of PCA, PCN, and PYO by colony biofilms grown in the dark or light for 96 h. Phenazines were extracted from both the biofilm and the underlying agar for each sample. Phenazine concentration was normalized to colony area. Bars represent the means of 10 biological replicates (circles), and error bars show the standard deviations. (B, top) Schematic showing the mechanism by which SoxR drives expression from the mexG promoter. Phenazines oxidize SoxR and trigger a conformational change that is transduced to the DNA and promotes transcription. (Bottom) Phenazine- and light-dependent expression of the SoxR-regulated mexG reporter in PA14 WT and Δphz strains. The expression of attB::PmexG-gfp in WT and Δphz was determined by measuring GFP fluorescence (excitation, 480 nm; emission, 510 nm) and normalized to the corresponding OD500. Data points represent averages of three biological replicates, and error bars represent the standard deviations. (C, top) PA14 Δphz biofilms grown in the dark or under white fluorescent light at ∼16.5 μmol photons m−2 s−1. The experiment was repeated at least three times. Scale bar, 5 mm. (Middle) c-di-GMP from biofilms grown on colony morphology assay medium and normalized to dry biomass. Bars indicate the averages from three biological replicates (circles), and error bars show the standard deviations. (Bottom) Congo red bound by biofilms grown in the dark or light and harvested at the indicated time points. Each bar represents the mean from four biological replicates (circles), and error bars show standard deviations. The P values were determined using unpaired two-tailed t tests (*, P ≤ 0.05; **, P ≤ 0.01; ***, P ≤ 0.001; n.s., not significant). (D, left) Relative levels of Congo red (CR) bound by WT and Δphz biofilms grown in dark and light at the 120-h time point, normalized to levels for WT grown in light. (Right) Relative c-di-GMP levels of WT and Δphz biofilms grown in dark and light at the 120-h time point with representative colony images, normalized to levels for WT grown in light. Scale bar, 5 mm.

