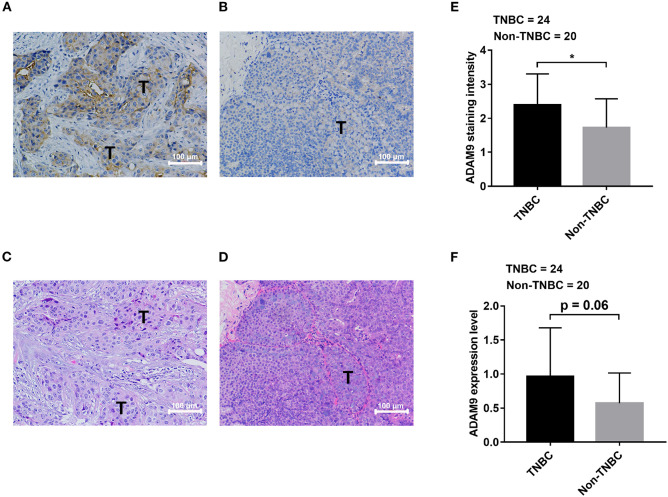
Figure 2.
ADAM9 expression is upregulated in tissues from TNBC patients compared with that of from non-TNBC patients. (A) Abundant staining of ADAM9 in tumor tissue from TNBC patients (n = 24); (B) Relatively weak staining of ADAM9 in tumor tissue from non-TNBC patients (n = 20); (C,D) Hematoxylin-eosin staining images of TNBC tumor tissues (C) and non-TNBC tumor tissues (D); (E,F) Independent sample t-test showed that significantly enhanced ADAM9 staining intensity (E) and expression level (F) in TNBC group (n = 24) compared with non-TNBC group (n = 20). (Expression level = ADAM9 staining intensity x ADAM9 staining percentage; A–D. X200 magnification; scale bars = 100 μm; *p-value < 0.05.

