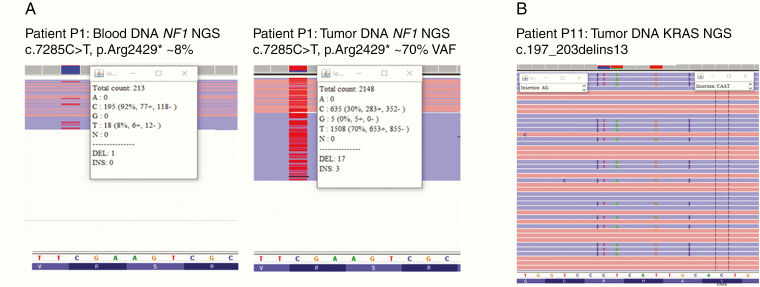
Figure 3.
(A) Image extracted from Integrative Genomics Viewer showing NF1 mutation at exon 50: c.7285C>T, p.Arg2429* in blood (left) and tumor (right) samples. (B) Image extracted from IGV showing the complex KRAS exon 3 mutation: c.197_203delins13, p.Ala66_Arg68delinsAspCysThrValLeu in tumor sample of patient P11.

