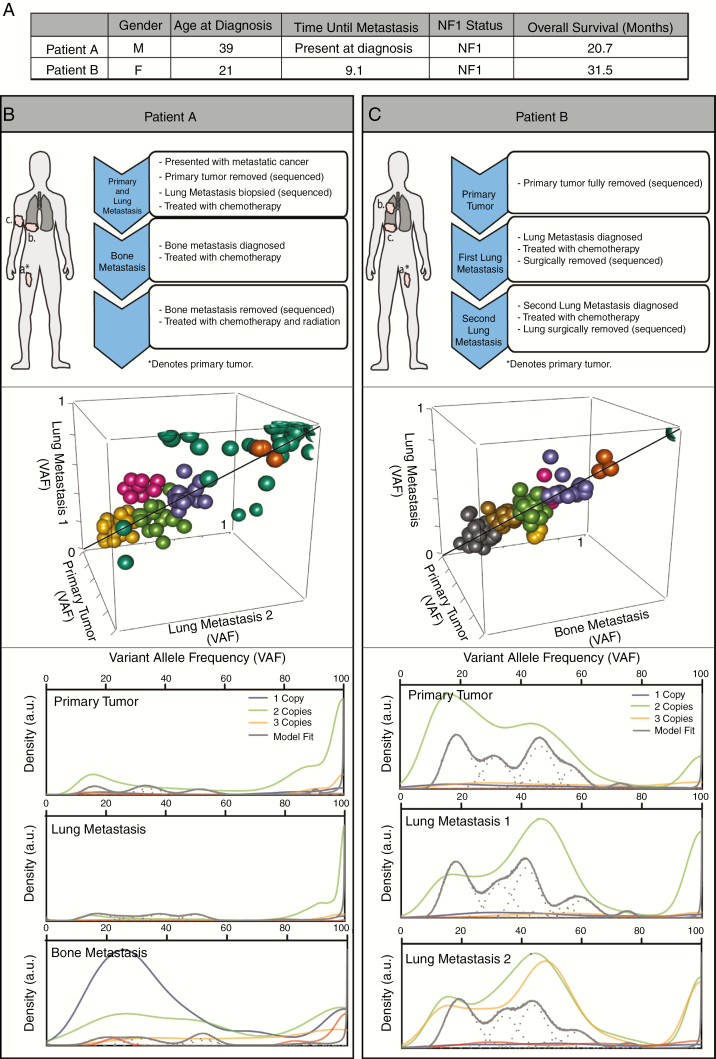
Figure 1.
Patient characteristics and establishing clonal origin of metastases within MPNSTs. (A) Patient characteristics at time of diagnosis and overall disease progression. (B, C Upper) MPNST Treatment progression for patients A and B after diagnosis. Three spatially distinct tumor samples were aligned to normal blood control from each individual. (B, C Middle) Still-frame of a 3-dimensional plot of VAF clusters of genomic signatures in copy number neutral regions compared across samples within a patient. (B,C Bottom) Kernel density plots of proportion of mutations at each VAF across genome. Densities were summated over all clusters for each cluster/component. Line color based on predicted ploidy (posterior predictive densities) of the cell: one (dark grey), two (green), or three (yellow).

