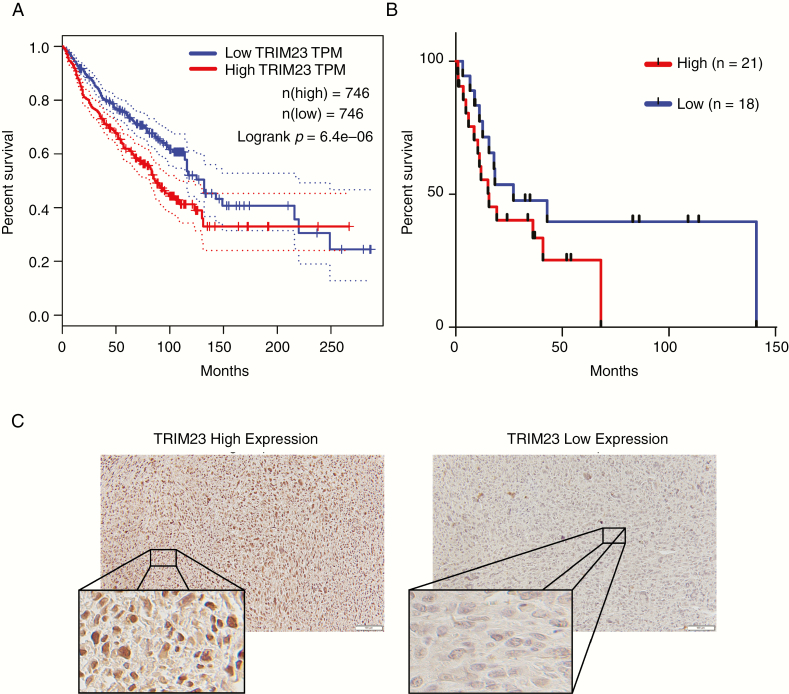
Figure 3.
Identification of TRIM Family as potential drivers of progression and survival. (A) Kaplan–Meier survival curves for TRIM23 expression in sarcoma (SARC), glioblastoma (GBM), and breast carcinoma (BRCA) from TCGA GEPIA database. (B) Kaplan–Meier survival curves for TRIM23 expression from a cohort staining analysis of MPNST patients from Washington University in St. Louis and UCSF (P = .15; n = 39). (C) Representative examples of TRIM23 staining in MPNST.

