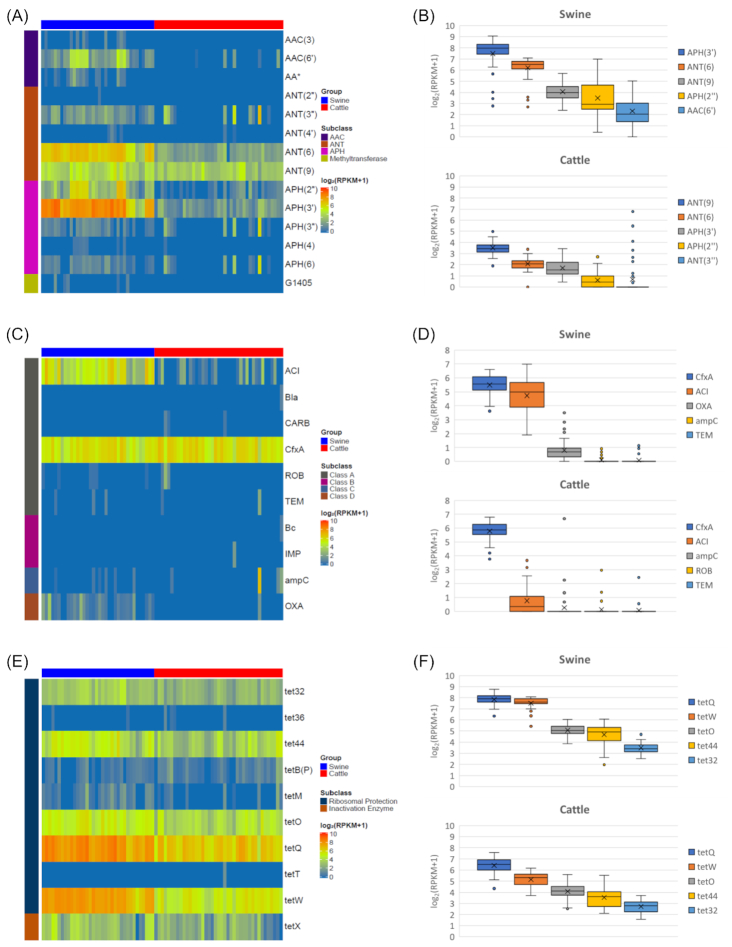
Figure 4:
Antibiotic resistance genes in swine and cattle gut microbiomes. Binary heat map showing the presence of resistance genes for (A) aminoglycosides, (C) β-lactams, and (E) tetracyclines. The 5 most abundant gene families of antibiotic resistance genes for (B) aminoglycosides, (D) β-lactams, and (F) tetracyclines. The y-axis represents log-transformed RPKM. Boxplots display the median as the middle line and x as the mean whilst the perimeters of the box display the 1st and 3rd quantiles of the data.The whiskers span the range of the 25% quantile or the 75% quantile plus 1.5 times the interquartile range, and dots are outliers.

