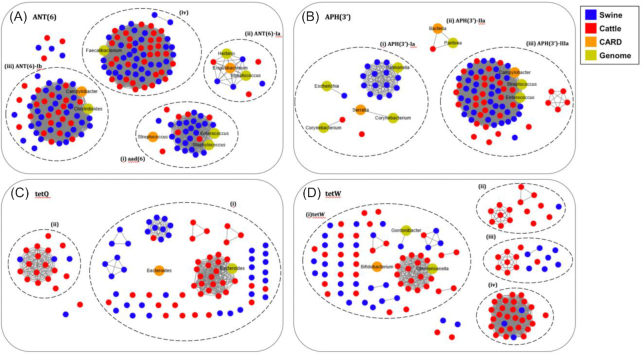
Figure 5:
Network analysis of resistance genes and their similarity in swine and cattle gut microbiomes. Network of (A) ANT(6), (B) APH(3′), (C) tetQ, and (D) tetW. The nodes in the network are resistance genes identified in swine (blue) and cattle (red), stored in the CARD database (orange) and identified from the bacterial complete genomes (yellow). The solid lines connecting nodes represent 100% similarity between 2 ARG sequences. The same ARG sequences from the samples were connected as a cluster. The clusters in each dotted circle show ≥98% similarity.

