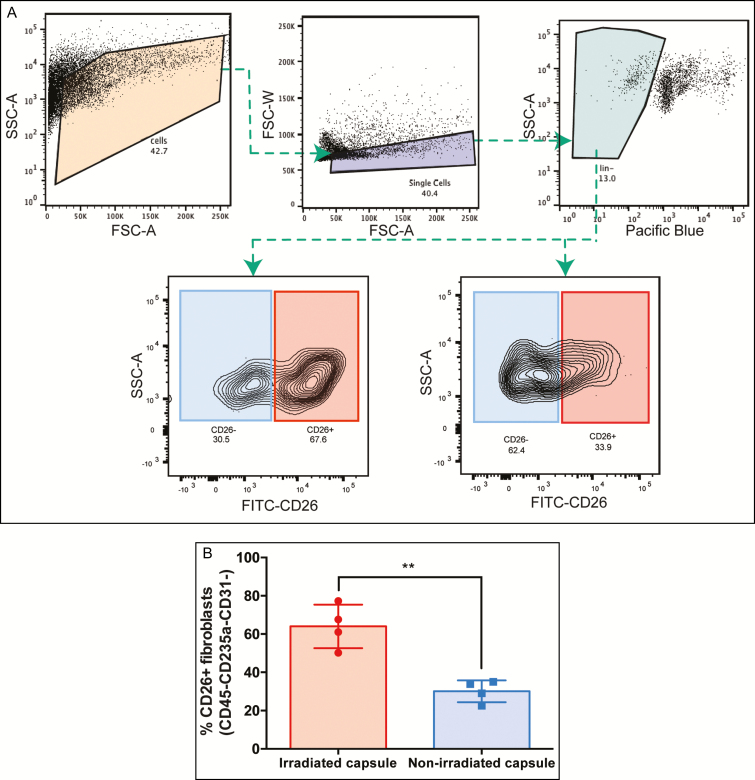
Figure 3.
(A) Flow cytometry plots illustrating the gating strategy used to isolate the CD26-positive and negative fibroblasts, with representative plots of the proportions of CD26-positive and CD-negative fibroblasts in irradiated (bottom left) and nonirradiated breast capsules (bottom right). (B) There was a higher percentage of CD26-positive fibroblasts in the irradiated compared with nonirradiated breast tissue (P = 0.0018**). SSC-A, side scatter area; FSC-A, forward scatter area; FSC-W, forward scatter width; FITC, Fluorescein Isothiocyanate; CD26, cluster differentiation 26.

