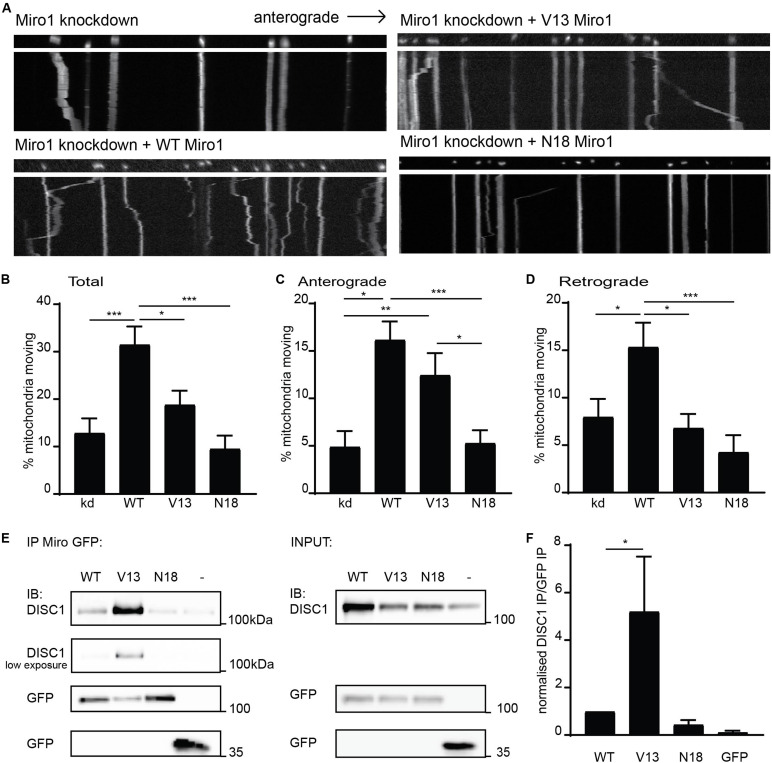
FIGURE 2.
Miro1 GTPase domain I state influences anterograde mitochondrial trafficking and DISC1 interaction. (A) Kymographs showing knockdown rescue experiments of mitochondrial trafficking upon knockdown of Miro1 and rescue with WT, V13, and N18 Miro1 in neuronal axons. (B) Quantification of mitochondrial trafficking reveals that expression of WT Miro1 can rescue mitochondrial trafficking after knockdown, whereas expression of GTPase domain I mutants V13 and N18 Miro1 cannot rescue the defect (N = 18 cells for all conditions, kd vs WT p < 0.001, kd vs V13 NS, kd vs N18 NS, WT vs V13 p < 0.05, WT vs N18 p < 0.001). (C) Quantification of anterograde mitochondrial transport as percentage of total mitochondria per axon shows that WT and V13 Miro1 can rescue mitochondrial trafficking, while N18 cannot (N = 18 cells for all conditions, kd vs WT p < 0.001, kd vs V13 p < 0.01, kd vs N18 NS, WT vs V13 NS, WT vs N18 p < 0.001, V13 vs N18 p < 0.05). (D) Quantification of retrograde mitochondrial transport shows that WT can rescue mitochondrial trafficking while V13 and N18 cannot (N = 18 cells for all conditions, kd vs WT p < 0.05, kd vs V13 NS, kd vs N18 NS, WT vs V13 p < 0.05, WT vs N18 p < 0.001). (E) GFP trap experiment from COS7 cells showing coIP of DISC1 with GFP-tagged Miro1 WT, V13, or N18. (F) Quantification of co-immunoprecipitated DISC1 band normalized to immunoprecipitated GFP Miro band. There is an increased amount of DISC1 pulled down with constitutively active, V13 Miro 1 compared to WT Miro1 (N = 5, p = 0.05).

