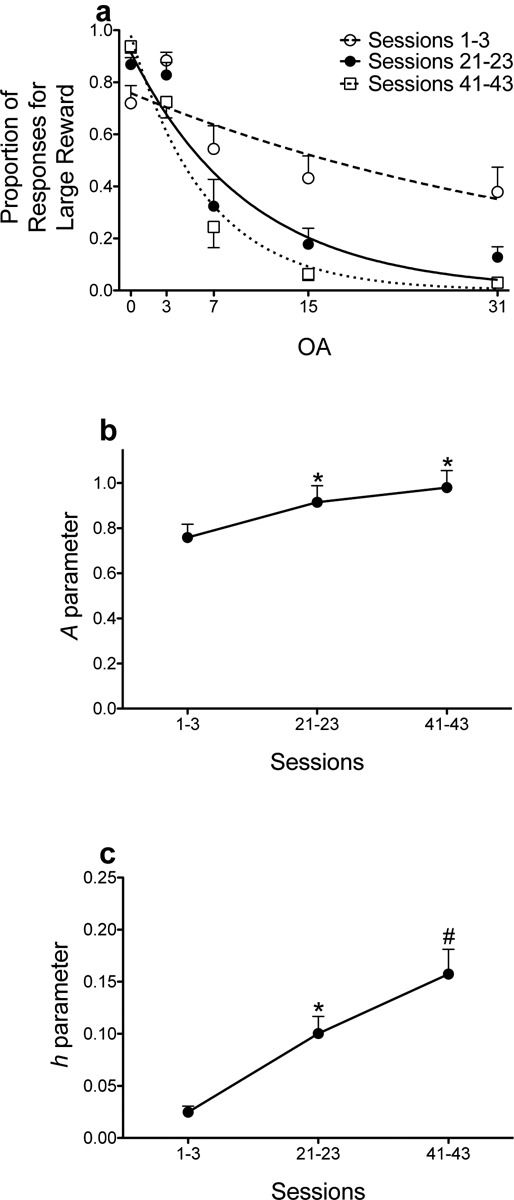
Figure 3.

Mean (±SEM) proportion of responses for the large, uncertain reinforcer as a function of odds against (OA) averaged across sessions 1–3, sessions 21–23, and sessions 41–43 (a). Lines are NLME-determined best fits of the exponential discounting function. Mean (±SEM) A (b) and h (c) parameter estimates across the sessions depicted in panel a. *p < .05, relative to sessions 1–3. #p < .05, relative to sessions 1–3 and sessions 21–23.
