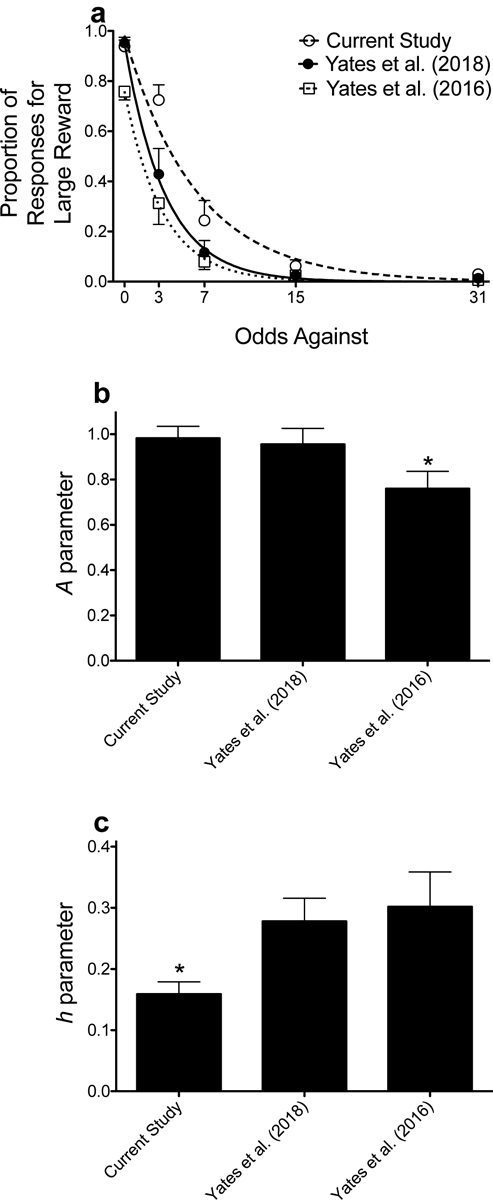
Figure 5.

Mean (±SEM) proportion of responses for the large, uncertain reinforcer as a function of odds against (OA) in the current experiment and in two of our previous studies (Yates et al. 2016; Yates, Prior, et al. 2018) (a). Lines are NLME-determined best fits of the exponential discounting function. Mean (±SEM) A (b) and h (c) parameter estimates across the experiments depicted in panel a. *p < .05, relative to the current experiment and the Yates, Prior, et al. (2018) study (b), and relative to the Yates, Prior, et al. (2018) and the Yates et al. (2016) studies (c).
