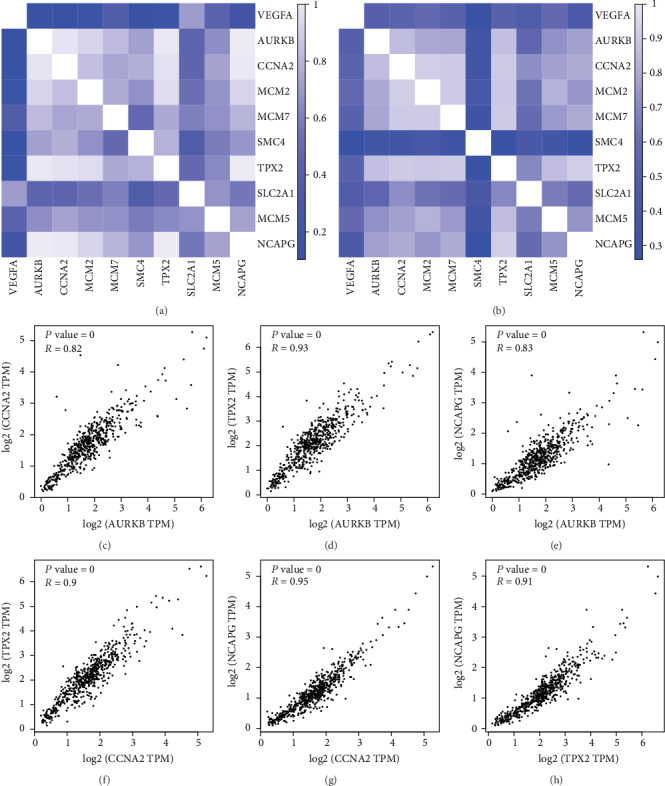
Figure 10.

(a) Heat maps showing the correlations between hub genes in the GSE105288 datasets. (b) Heat maps showing the correlations between hub genes in the GSE66272 datasets. (c) The correlation between AURKB and CCNA2. (d) The correlation between AURKB and TPX2. (e) The correlation between AURKB and NCAPG. (f) The correlation between CCNA2 and TPX2. (f) The correlation between AURKB and NCAPG. (g) The correlation between CCNA2 and NCAPG. (h) The correlation between TPX2 and NCAPG.
