Figure 12.

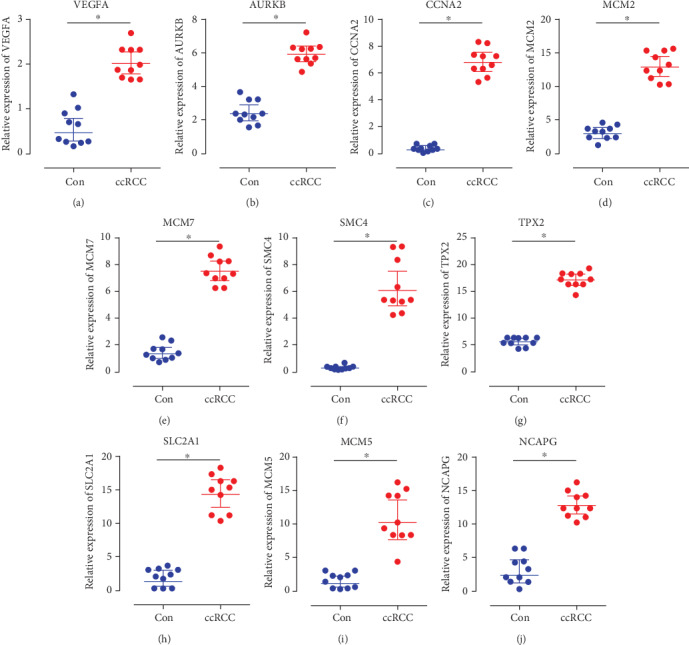
Relative expression of VEGFA, AURKB, CCNA2, MCM2, MCM7, SMC4, TPX2, SLC2A1, MCM5, and NCAPG by RT-qPCR analysis. ∗P < 0.05, compared with normal kidney tissues.

Relative expression of VEGFA, AURKB, CCNA2, MCM2, MCM7, SMC4, TPX2, SLC2A1, MCM5, and NCAPG by RT-qPCR analysis. ∗P < 0.05, compared with normal kidney tissues.