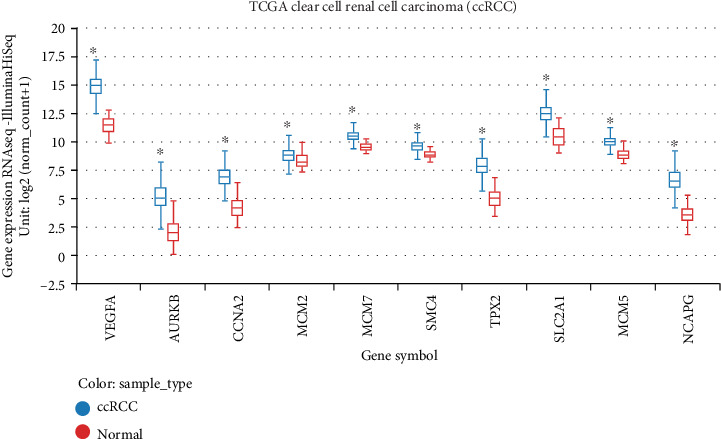
Figure 13.

The confirmation of gene expression level using The Cancer Genome Atlas (TCGA) data. The gene expression levels of VEGFA, AURKB, CCNA2, MCM2, MCM7, SMC4, TPX2, SLC2A1, MCM5, and NCAPG in ccRCC samples were significantly higher than the normal renal samples.
