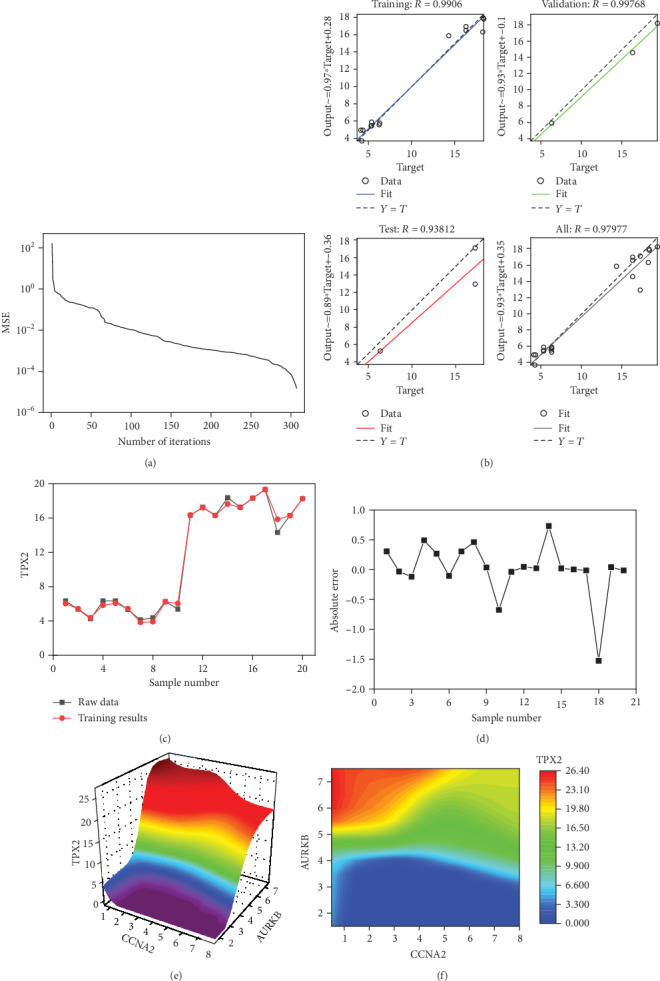
Figure 15.

The neural network models. (a) The best training performance. (b) The relativity of training, validation, test, and all procedure. (c) The comparison chart of training results. (d) The error analysis diagram. (e) The high-risk warning range at the level of the three-dimensional stereogram. (f) The high-risk warning range at the level of the plane form.
