Figure 1.

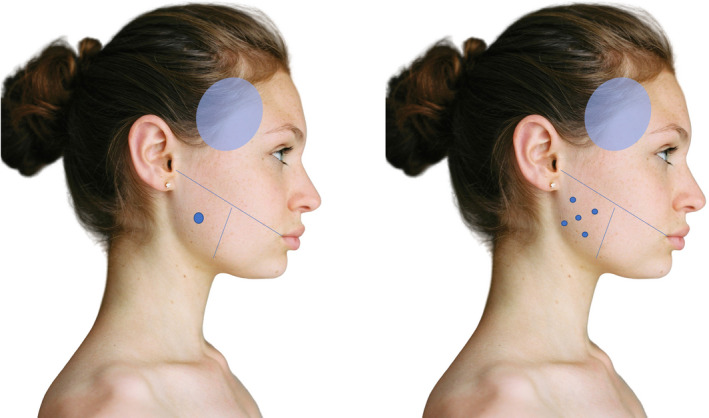
Schematic illustration of the injection location (blue dots) for the single‐injection (SIT) and the multi‐injection technique (MIT). The blue area represents the area for objective volume measurements

Schematic illustration of the injection location (blue dots) for the single‐injection (SIT) and the multi‐injection technique (MIT). The blue area represents the area for objective volume measurements