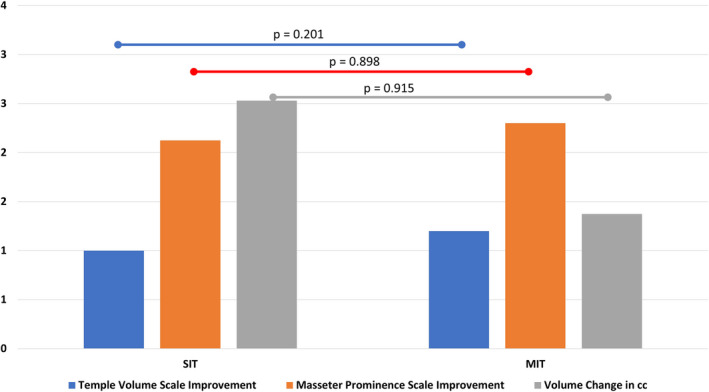
Figure 3.

Bar graph showing the differences between baseline and follow‐up stratified by the two utilized injection techniques: single‐injection (SIT) and the multi‐injection technique (MIT). Probability values are given to estimate statistical significance
