Figure 4.

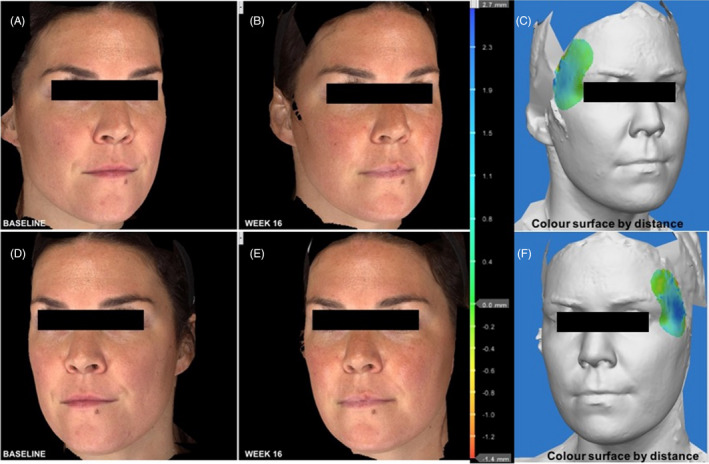
Pre‐ and postinjection outcomes in temporal fossa volume with green demonstrating moderate (0.2‐0.4 mm) increase in volume, and blue demonstrating major (1‐2.7 mm) increase in volume

Pre‐ and postinjection outcomes in temporal fossa volume with green demonstrating moderate (0.2‐0.4 mm) increase in volume, and blue demonstrating major (1‐2.7 mm) increase in volume