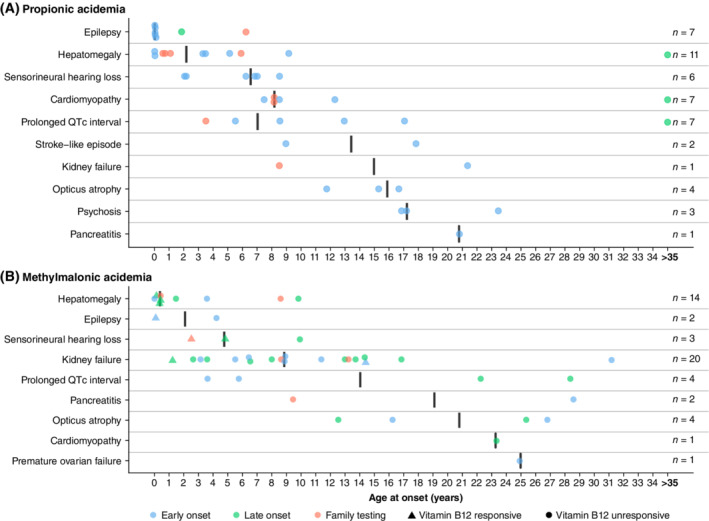
Figure 2.

Age at onset of mitochondrial complications with acute onset. A, Depicts propionic acidemia; B, depicts methylmalonic acidemia. The y‐axis depicts the mitochondrial complications with acute onset, ordered on median age at onset. The x‐axis depicts patient age in years, with a maximum of 35 years of age. For all ages >35 years, the circles have been placed at 35 years. The black vertical lines depict the median age at onset. The filled circles and triangles depict the individual patient age at onset of a complication. Circles depict no vitamin B12 responsiveness, triangles depict vitamin B12 responsiveness of methylmalonic acidemia patients. Blue circles and triangles depict early onset, green circles and triangles depict late onset, orange circles and triangles depict diagnosis through family testing. Early onset: presentation ≤28 days of life; late onset: presentation >28 days of life
