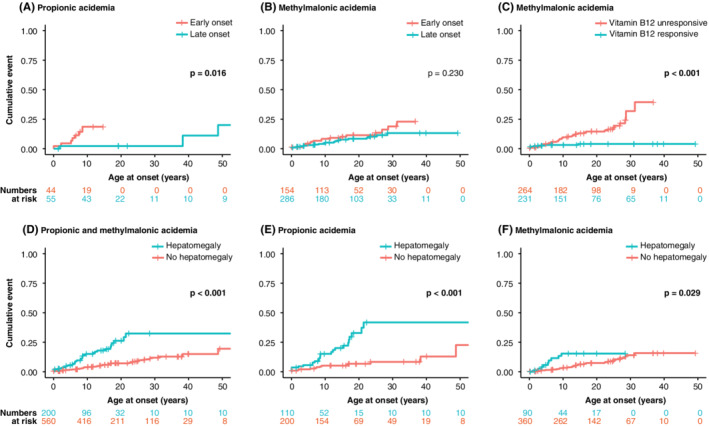
Figure 3.

Factors associated with increased risks for mitochondrial complications with acute onset. Kaplan‐Meier plots wherein the y‐axis depicts the cumulative percentage and the x‐axis depicts patient age in years. Numbers at risk for the subgroups, indicating for how many complications the patients are at risk, are depicted below the panels, in corresponding colours. Panels A and B demonstrate late onset in blue vs early onset in orange for propionic acidemia (PA) in (A) and for methylmalonic acidemia (MMA) in (B). Early onset: presentation ≤28 days of life; late onset: presentation >28 days of life. Panel C demonstrates vitamin B12 responsiveness in blue vs vitamin B12 unresponsiveness in orange for MMA. Panels D‐F depicts the association of the presence of hepatomegaly to other mitochondrial complications with acute onset in blue, vs no hepatomegaly in orange, in (D) for both PA and MMA, in (E) for PA, and in (F) for MMA
