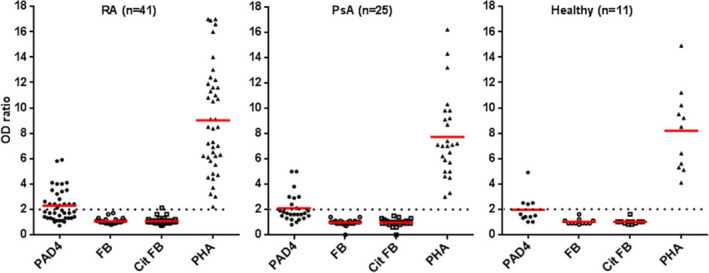
Figure 2.

Proliferation of T cells in response to human PAD4, native fibrinogen (FB), citrullinated fibrinogen (cit FB), and phytohemagglutinin (PHA) in patients with RA, patients with PsA, and healthy controls. Proliferative response was evaluated by bromodeoxyuridine incorporation (n = 4 replicates per protein). The OD ratio was the ratio of the OD for a well with cells and protein to the OD for a well with cells but without protein. Positivity was defined as an OD ratio of >2 (dotted lines). Symbols represent individual subjects; red lines show the mean OD ratio. See Figure 1 for other definitions.
