
Figure 4.
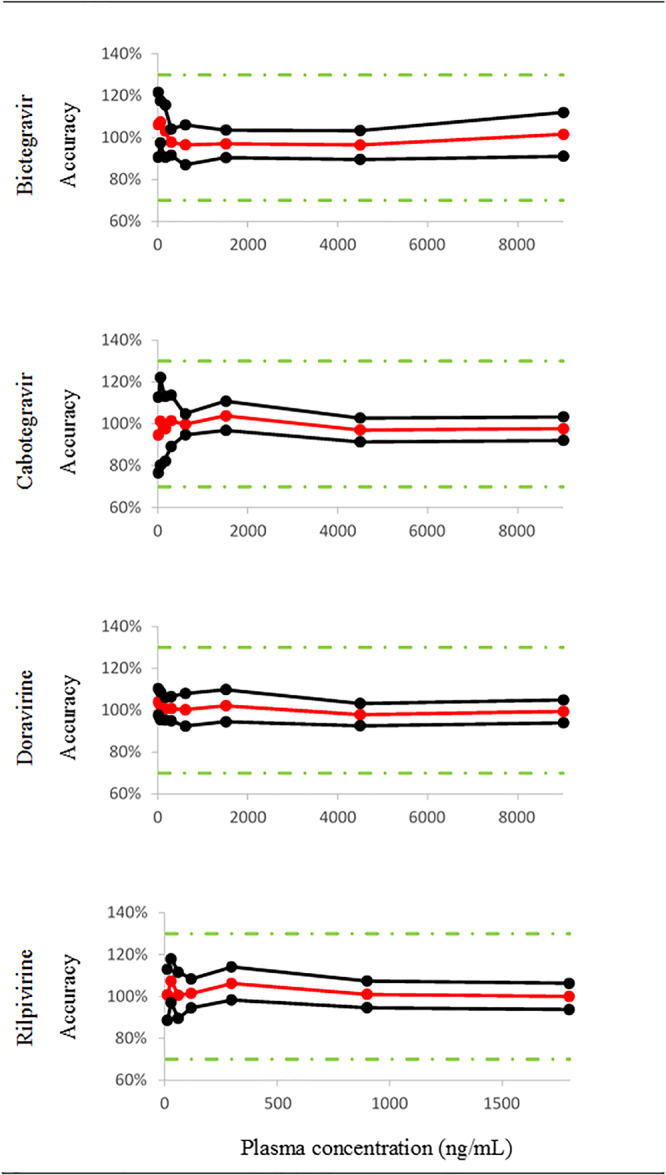
Accuracy profiles over the validated domain in human plasma of the five comedications and the two metabolites. Trueness (red solid line), upper and lower β‐expectation tolerance intervals (β = 80%) (black solid lines) and acceptance limits (λ = ±30%, green dotted lines) are shown [Colour figure can be viewed at wileyonlinelibrary.com]