Figure 5.

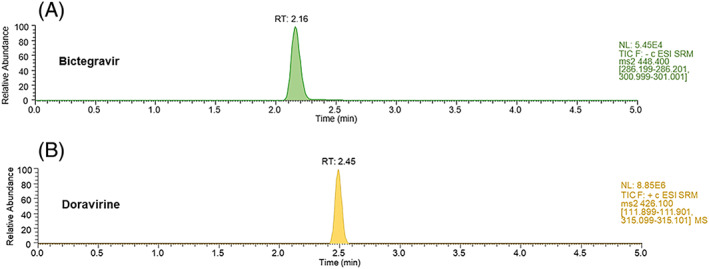
Chromatographic profile of a plasma from one HIV‐infected individual receiving bictegravir 50 mg once daily (A) and from another patient receiving doravirine 100 mg once daily (B) [Colour figure can be viewed at wileyonlinelibrary.com]

Chromatographic profile of a plasma from one HIV‐infected individual receiving bictegravir 50 mg once daily (A) and from another patient receiving doravirine 100 mg once daily (B) [Colour figure can be viewed at wileyonlinelibrary.com]