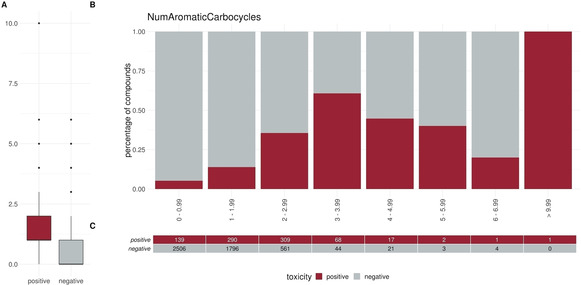
Figure 4.

Distribution of the descriptor NumAromaticCarbocycles (number of aromatic carbocycles) between positives and negatives (A) Box or Violin plots of the distribution of the positives (red) and negatives (grey) compounds in our dataset (without the external test set) (B) Percentage histograms of the dataset. Each bar indicates the percentage of the positives compounds (red) and the percentage of the negatives compounds (grey) for the respective bin. (C) Number of positives (red) and negatives (grey) compounds per bin in the percentage histogram
