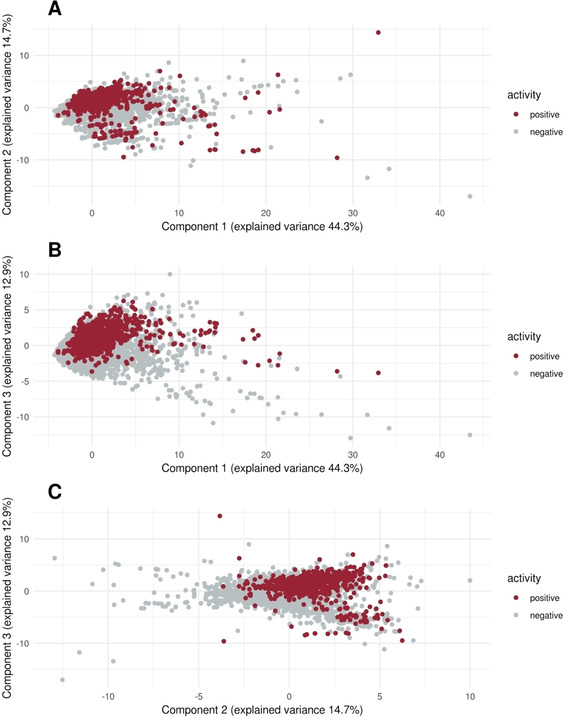
Figure 8.

Principal components 1–3. Principal component analysis of the dataset with indication of the positives (red) and negatives (grey). (A) Plot of the first and second principal component (B) Plot of the first and third principal component (C) Plot of the second and third principal component
