
Figure 2.
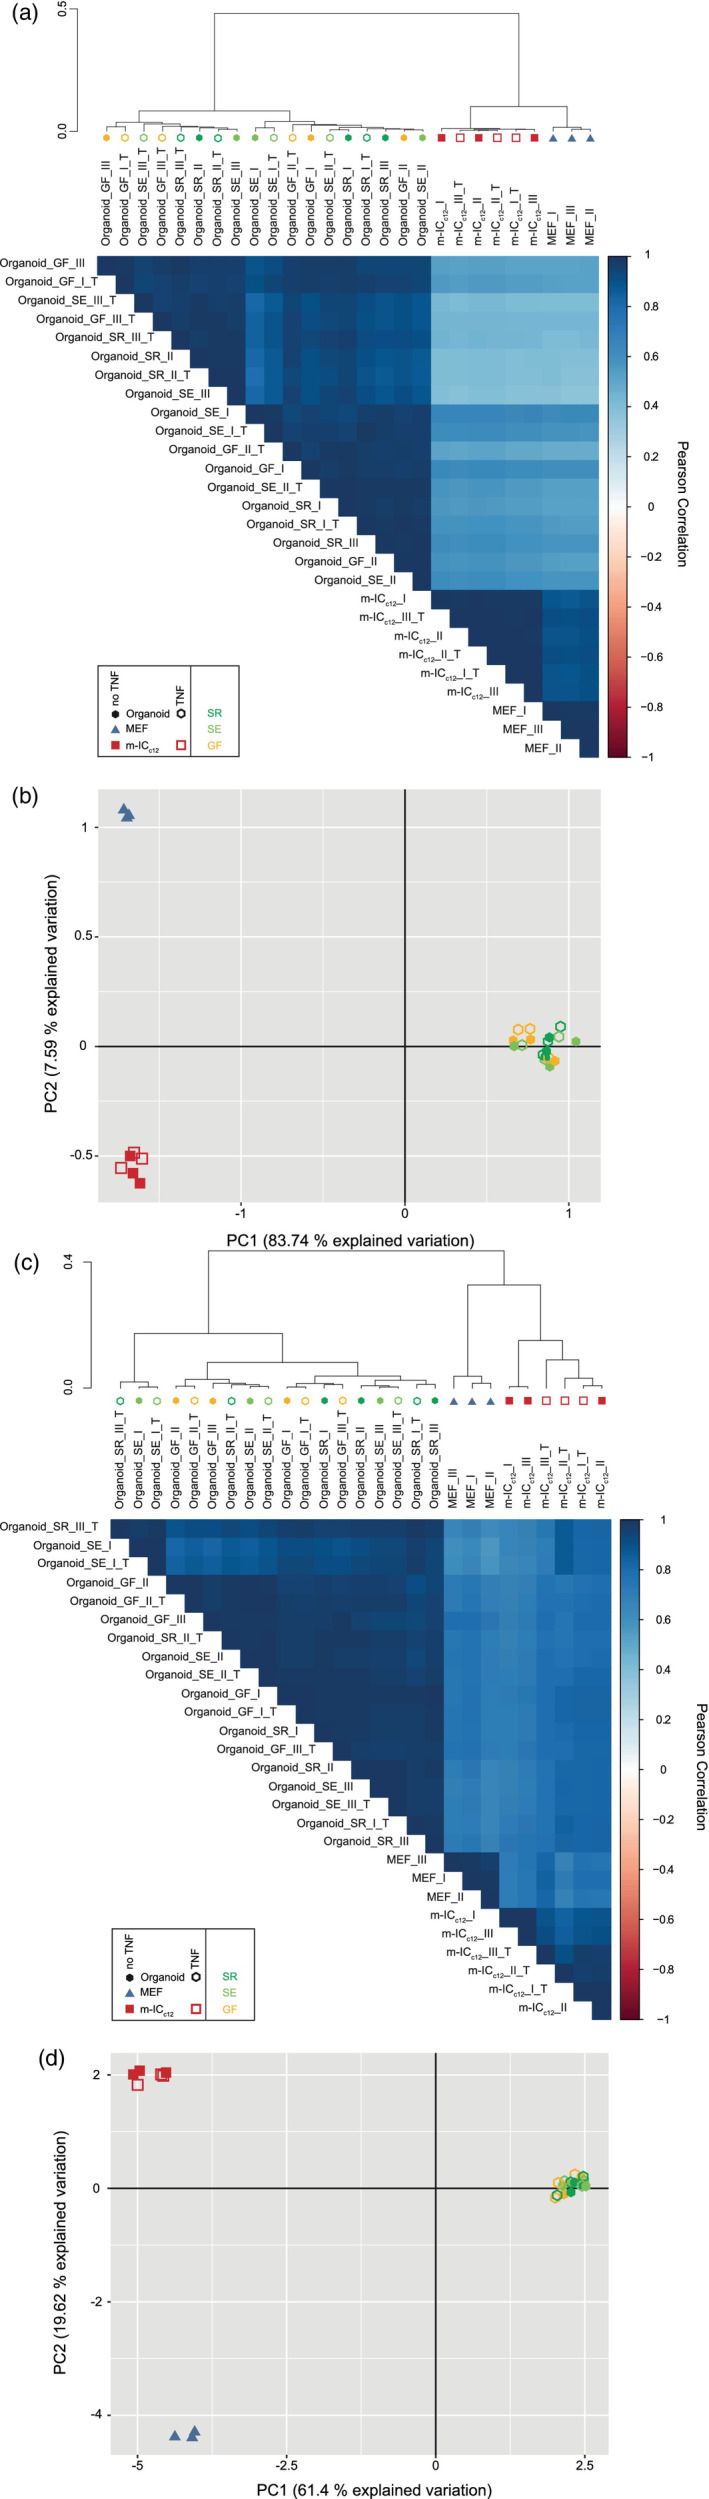
Stochastic variability between separate organoid cultures has a stronger impact on global gene expression than a defined, physiological stimulus. (a) Unsupervised hierarchical clustering analysis of the proteome data set including untreated (closed symbols) and TNF‐treated (5 ng/mL, 8 hr; open symbols;_T) organoid (Organoid_I‐III, hexagon symbol) samples from mice raised in SPF facility 1 (_SR, dark green), SPF facility 2 (_SE, light green) or the germ‐free facility (_GF, yellow), as well as MEF (MEF_I‐III, blue triangle symbol) and m‐ICc12 cell (m‐ICc12_I‐III, red square symbol) samples. Correlation matrix depicts Pearson correlation values between indicated samples. (b) Principal component analysis of the proteome data set as described in (a). (c) Unsupervised hierarchical clustering analysis of the transcriptome data set for the samples described in (a). (d) Principal component analysis of the transcriptome data set as described in (c)