
Figure 3.
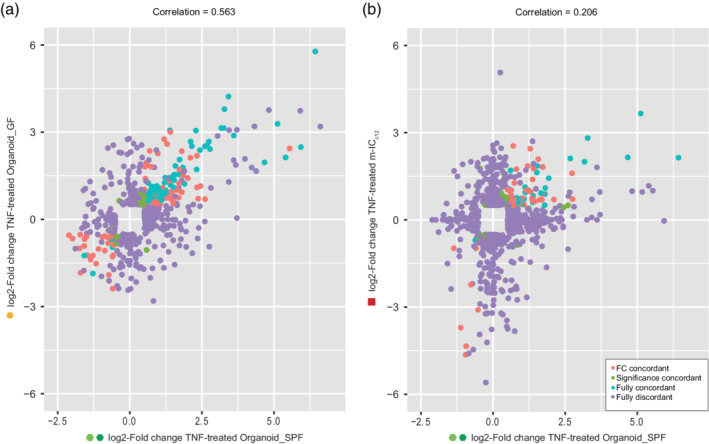
The TNF‐induced transcriptional response of organoids from germ‐free and colonised mice shows robust correlation. (a) Correlation plot of TNF‐induced changes in germ‐free mouse derived organoids (y‐axis, Organoid_GF) plotted against TNF‐induced changes in SPF‐derived organoids (x‐axis, Organoid_SPF). (b) Correlation plot of TNF‐induced changes in m‐ICc12 cells (y‐axis, m‐ICc12) plotted against TNF‐induced changes in SPF‐derived organoids (x‐axis, Organoid_SPF). Shown are fully concordant hits (blue), hits concordant in fold change (FC; red), hits concordant in p‐value (green) and fully disconcordant hits (purple). Cut‐offs: genes with log2 ratio <−0.5 or >0.5 and p‐value <0.05 and above background noise in at least one of the sample groups