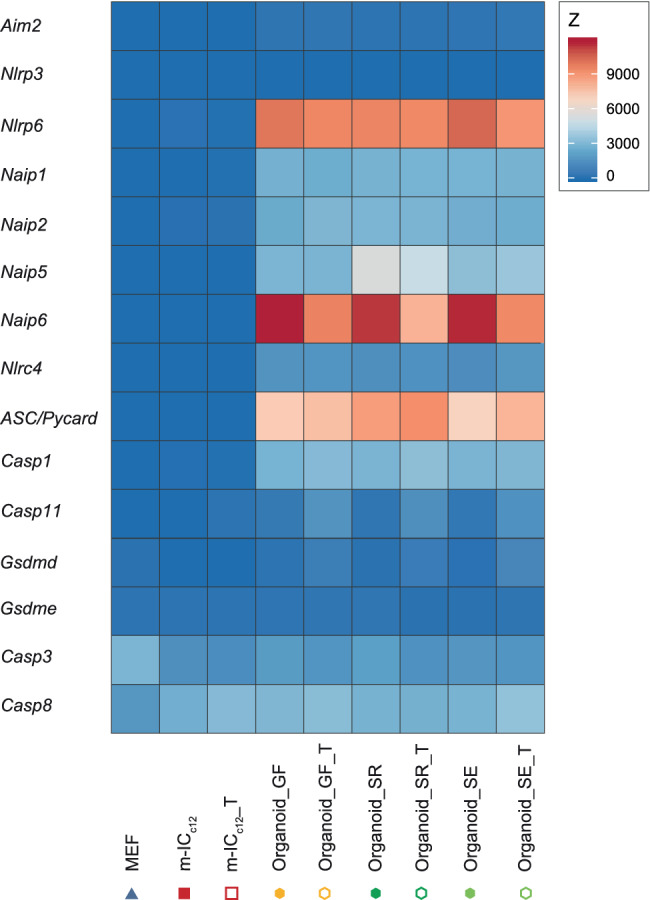
Figure 5.

Inflammasome components are highly expressed in organoids compared to m‐ICc12 cells and fibroblasts. Heat map depicting expression levels of several inflammasome components in untreated or TNF‐treated (_T) organoids (Organoid_I‐III, hexagon symbol) samples from mice raised in SPF facility 1 (_SR, dark green), SPF facility 2 (_SE, light green) or the germ‐free facility (_GF, yellow), as well as untreated or TNF‐treated (_T) m‐ICc12 cell (m‐ICc12_I‐III, red square symbol) and MEF (MEF_I‐III, blue triangle symbol) samples
