
Figure 3.
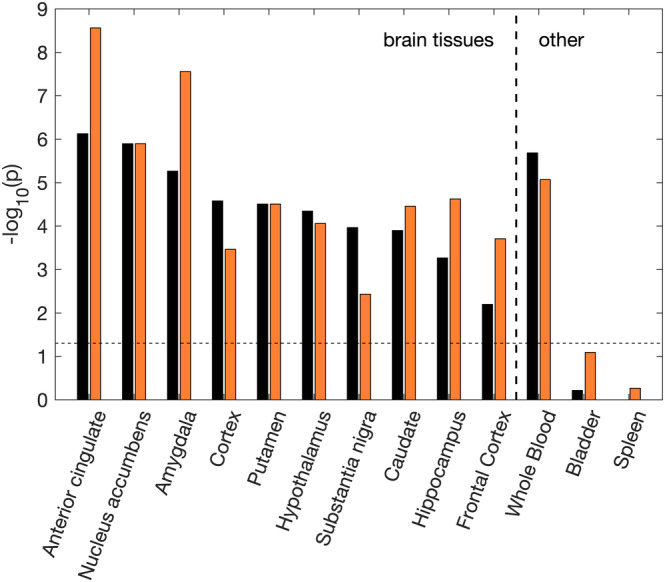
Enrichment results for the PGC‐OCD (black) and the OCD + compulsion symptoms meta‐analysis (orange). Enrichment of tissue‐specific differentially expressed genes (DEGs) was determined using the hypergeometric test. The y‐axis shows the Bonferroni corrected significance of the test as –log 10(p). The dashed line indicates the significance threshold (p = .05). Significance strongly increased for some brain tissues (over 1 point increase for ACC, amygdala, hippocampus and frontal cortex), and decreased for others (over 1 point decrease for cortex, substantia nigra) [Color figure can be viewed at wileyonlinelibrary.com]