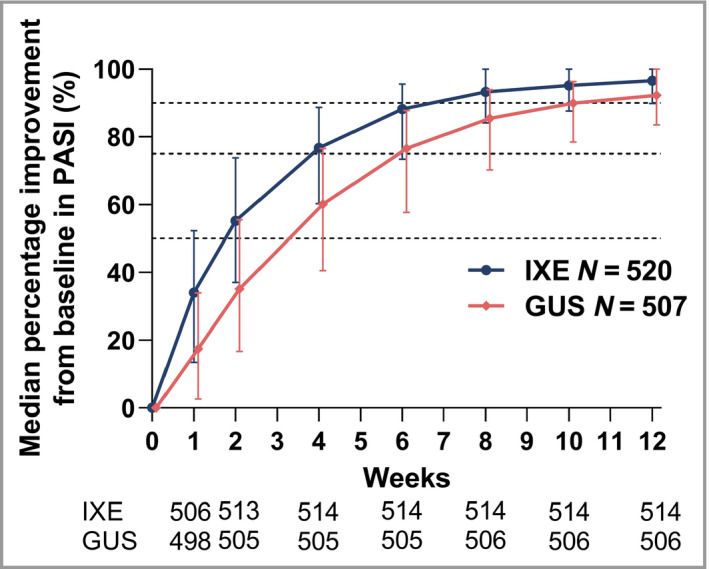
Figure 3.

Median percentage improvement from baseline in Psoriasis Area and Severity Index (PASI). Data are shown as median percentage (with interquartile range). Listed below the x‐axis are the numbers of patients with nonmissing data for each time point. Modified baseline observation carried forward was used for missing data. Dashed lines mark 50%, 75% and 90% thresholds for improvement in PASI. GUS, guselkumab; IXE, ixekizumab.
