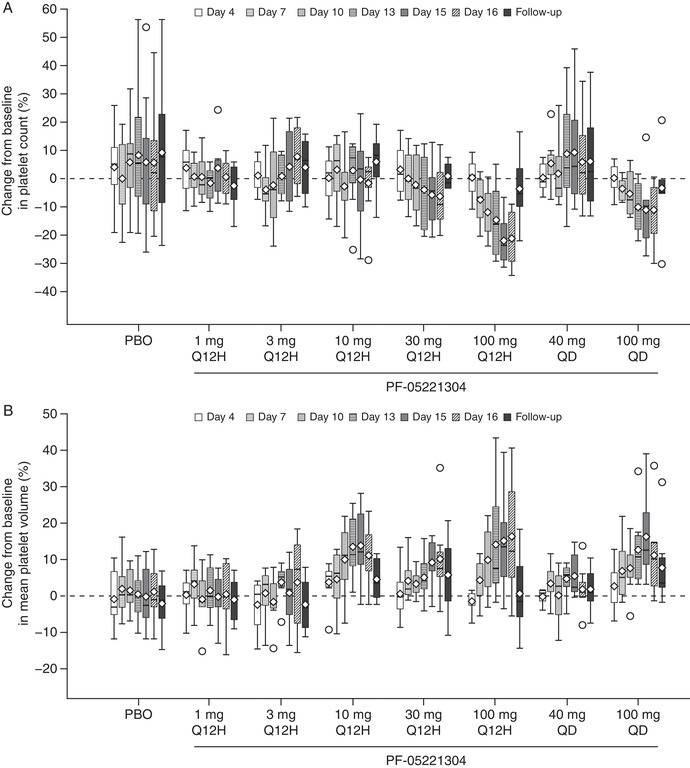
Figure 5.

Percentage change from baseline in platelet count (A) and mean platelet volume (B) on repeated dosing. The box plots provide medians with 25% and 75% quartiles, with whiskers to the last point within 1.5 times the interquartile range. Diamonds represent the arithmetic means and circles represent the outliers. Unplanned readings were not included. Follow‐up visits were 8 ± 3 days after the last dose of study drug. PBO, placebo; Q12H, every 12 hours; QD, once daily.
