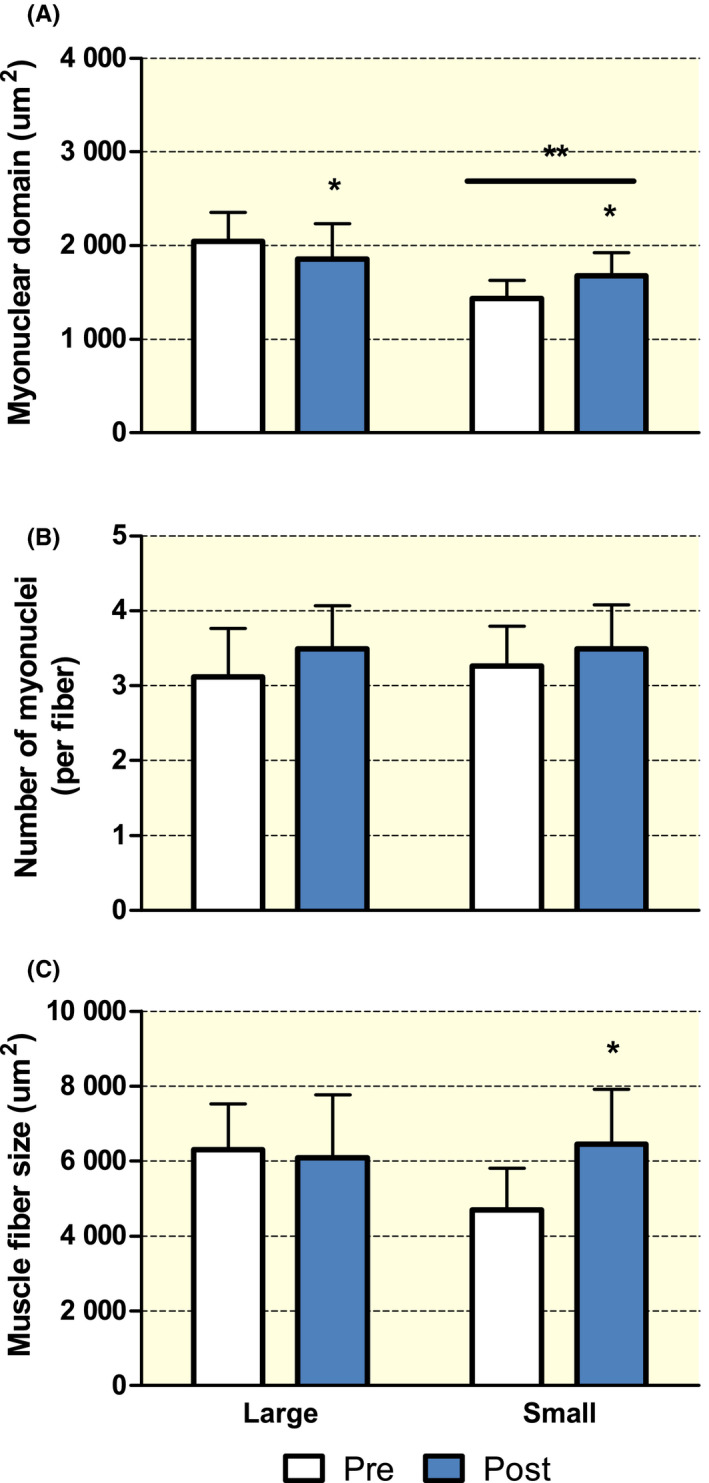
FIGURE 4.

Changes in myonuclear domain size (A), myonuclear content (B) and muscle fibre size (C) in healthy older adults with a relatively small (<1600 µm2; Small group; n = 15) or large (>1800 µm2; Large group; n = 12) myonuclear domain size at baseline (pre) and after (post) 12 weeks of progressive resistance exercise training. Myonuclear content and fibre size were determined by immunofluorescent microscopy as described previously10. Muscle satellite cells were identified by NCAM staining and excluded from the myonuclear counts. Data were analysed with a two‐way repeated measures ANOVA with time (Pre vs Post) as within subject factor and group (Small vs Large) as between subject factor. A significant group × time interaction was observed for muscle fibre size (P < .05) as well as myonuclear domain size (P < .05), resulting in separate one‐way repeated measures ANOVAs and pairwise comparisons being performed to identify within‐group effects. Data are expressed as means ± SD. *Significantly different compared with Pre, P < .05. **Significantly different compared with Large group, P < .05. Horizontal line indicates that the effect is present for both time points
