
Figure 1.
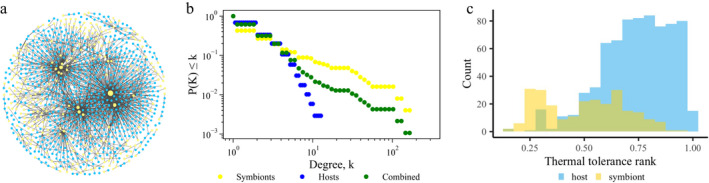
(a) Visualization of the global coral–symbiont network. Host nodes are in blue and symbiont nodes are in yellow. Size corresponds to degree. (b) Degree distribution, cumulative probability of nodes in the network having degree k, of the global network considering hosts and symbionts together (combined) and separately. (c) Distribution of thermal tolerances of host and symbiont nodes in the global network.