
Figure 2.
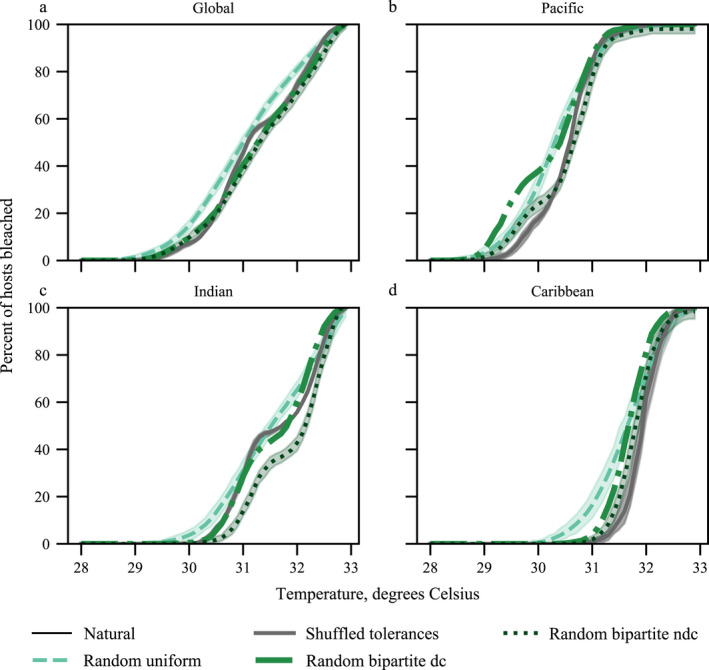
Percentage of hosts bleached as a function of each degree Celsius of temperature increase of the 100 simulations of the bleaching model (Eq. 1) on the (a) global, (b) Pacific Ocean, (c) Indian Ocean, and (d) Caribbean Sea networks and each of their associated null networks (dc, degree conserved; ndc, non‐degree conserved). Shaded regions are the 97% confidence intervals.