
Figure 3.
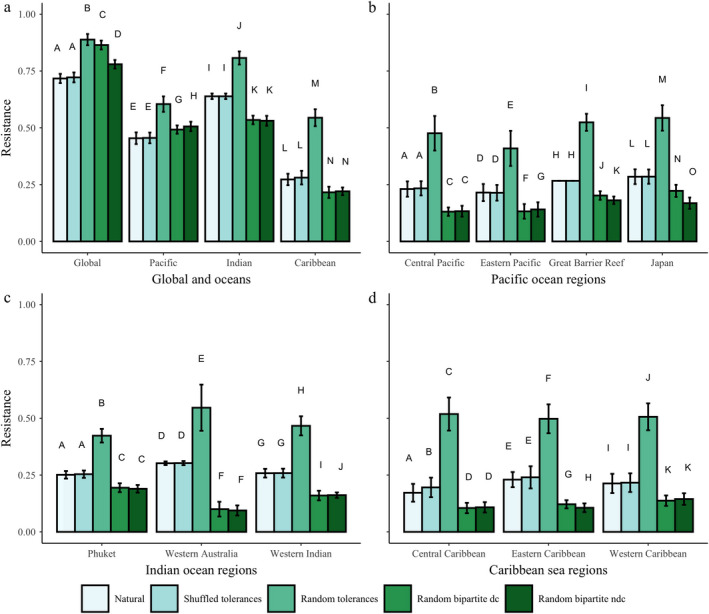
Resistance of the networks (all spatial scales and their associated nulls) to thermal stress calculated as the increase in temperature from 10% of hosts bleached to 90% of hosts bleached and then normalized by the maximum possible temperature change in this range (3°C, T Δ). Error bars represent the standard deviation of the mean resistance determined from the 100 simulations. Different letters above bars signify significant differences (P ≤ 0.05) determined by the randomization tests described in detail in Appendix S2.