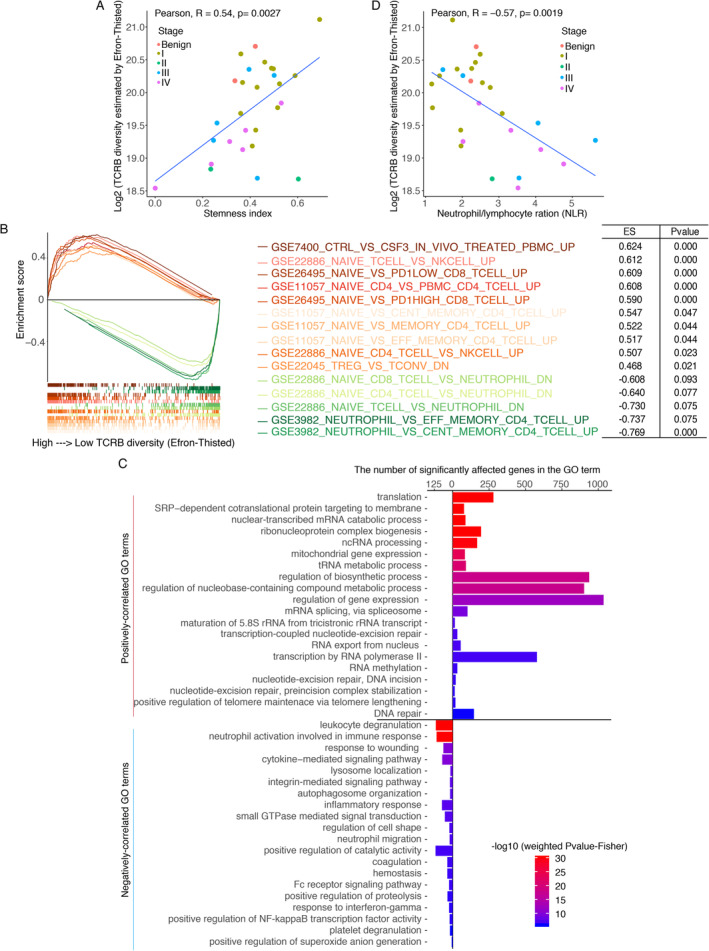
Figure 1.

Correlation between basic TCRB diversity and other indexes. (A) The relationship between TCRB diversity and stemness indexes. (B) Correlation between the GSVA scores of c7 immune terms and TCRB diversity. Multiple significant GSEA mountain plots were merged into a single plot, with the orange lines indicating positively correlated terms and the green lines representing negatively correlated terms. Each term was attached to an enrichment score (ES) and a P value. (C) Enriched GO terms for genes correlated with TCRB diversity. The plot includes the top 20 positive and top 20 negative GO terms according to the weighted Fisher's P value. (D) Relationship between TCRB diversity and the NLR.
