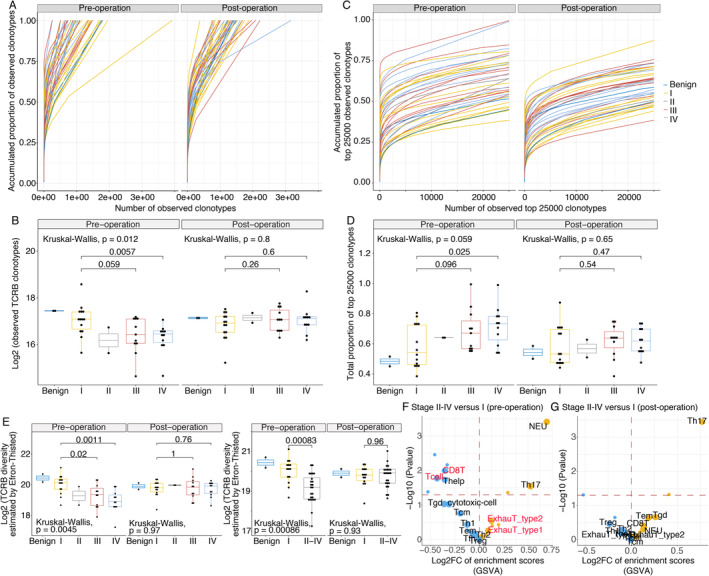
Figure 2.

The peripheral immune cells in treatment‐naïve patients with stage II–IV disease are less diversified than those in patients with stage I disease before surgery. The total observed TCRB clonotype count (A and B), accumulated proportion of the top 25 000 clonotypes (C and D) and the TCRB diversity index (Efron–Thisted) (E) were compared among treatment‐naïve patients with different disease stages before and after surgery. Multiple group statistical analysis was performed using the Kruskal–Wallis test, and pairwise comparison was performed using a Wilcoxon test. These results suggested that the TCRB diversity in stage I patients was significantly more abundant than that in stage IV patients. Volcano plot comparing the GSVA‐based immunophenotypic scores in disease stages II–IV with that in stage I of pre‐operation (F) and post‐operation (G). In the volcano plot, the dots that represent T‐cell subtypes, neutrophils, and monocytes, are enlarged and labelled with the corresponding text. The activated and depressed immune cell subsets are shown in yellow and blue, respectively. Statistical P values less than 0.05 are indicated above the horizontal red dashed line.
