Figure 5.

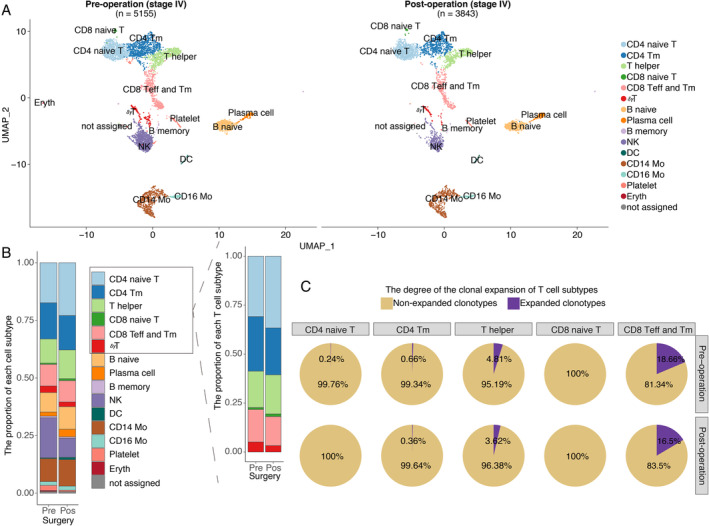
The proportion of naïve T cells increased after CN as determined by scRNA. scRNA data from a validated stage IV treatment‐naïve patient are shown. (A) Pre‐operative peripheral blood mononuclear cell (PBMC, n = 5155 cells) and post‐operative PBMC (n = 3843 cells) samples from a validated stage IV treatment‐naïve RCC patient are shown. Each dot represents a cell. Clusters were identified by principal component analysis and visualized with uniform manifold approximation and projection (UMAP). CD4 naive T: CD4 naïve T cells; CD4 Tm: CD4‐positive memory T cells; T helper: T helper cells; CD8 naive T: CD8 naïve T cells; CD8 Teff and Tm: a cluster including CD8‐positive effector T cells and memory T cells; γδT: T cells with TCRγ and δ chains; B naive: naïve B cells; Plasma cell: plasma cells; B memory: memory B cells; NK: nature killer cells; DC: dendritic cell; CD14 Mo: classic monocyte; CD16 Mo: monocyte expressing CD16; Platelet: platelet; Eryth: erythrocyte; not assigned: cells were not assigned. (B) The stack bar plot shows the proportions of all subtypes in all peripheral blood and T cell populations. (C) Pre‐operative (n = 2592) and post‐operative (n = 2208) αβT cells are shown. The pie chart represents the distribution of TCRB clonotypes with different abundances in different T‐cell subtypes. A clonotype that is detected more than once is defined as a clonotype that has undergone clonal expansion. Clonal expansion occurs in the memory and effector T cells and the naïve T cells exhibited high clonal diversity.
