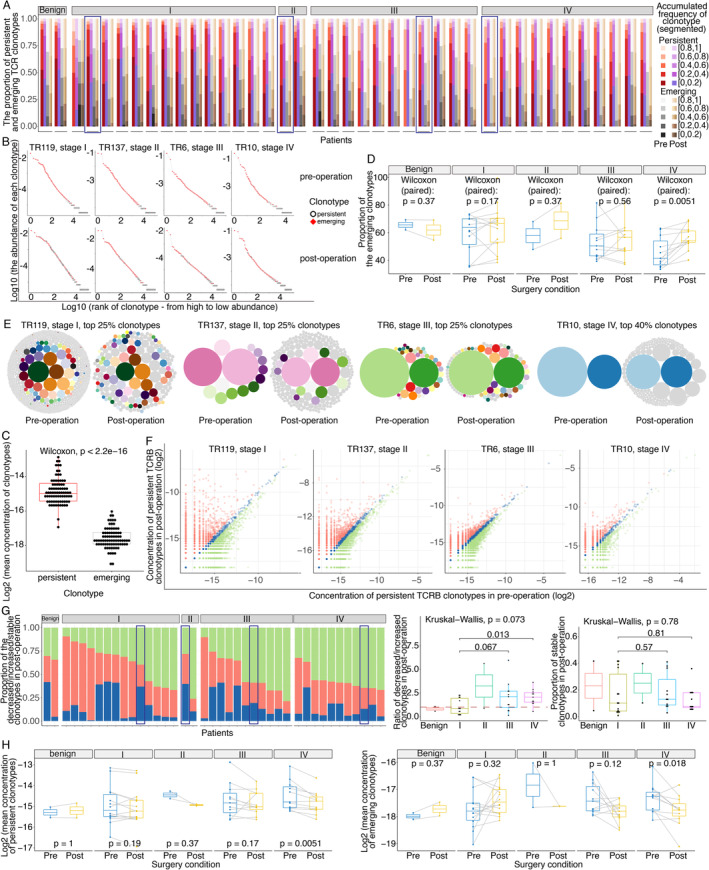
Figure 6.

Characteristics of persistent and emerging clonotypes before and after surgery. (A) The composition ratios of the proportions of persistent and emerging clonotypes in segments with different cumulative frequencies. The red, purple, grey, and brown gradient‐filled bar represents the segmented cumulative frequencies of clonotypes ranked from high to low abundance as follows: persistent clonotypes pre‐operation, persistent clonotypes post‐operation, emerging clonotypes pre‐operation, and emerging clonotypes post‐operation. Each dash represents a patient, and the detailed order of the patients is TR183, TR95, TR116, TR119, TR186, TR45, TR55, TR56, TR58, TR59, TR60, TR65, TR66, TR79, TR86, TR88, TR137, TR169, TR128, TR16, TR17, TR182, TR184, TR22, TR23, TR6, TR70, TRPT180, TRT141, TR10, TR102, TR123, TR15, TR156, TR179, TR24, TR27, TR63, TR83, and TRML21. The four representative patients are marked with rectangular frame. (B) Abundances of persistent clonotypes in four representative patients. The plot in the first row shows pre‐operative TCRB clonotypes, and the plot in the second row shows post‐operative clonotypes. The abscissa represents each individual clonotype, ranked from high abundance to low abundance, and the ordinate depicts the frequency (log10‐transformed) of each clonotype. Red squares indicate persistent clonotypes, and white hollow circles indicate emerging clonotypes. The marked persistent clonotypes were concentrated among high‐frequency clonotypes in both pre‐ and post‐operative samples. (C) Difference in the mean concentrations of persistent and emerging clonotypes. (D) Paired changed proportions of emerging clonotypes before and after surgery in patients with different stages. (E) Changes in high‐abundance clonotypes in the four representative patients before and after surgery. Each circle represents a clonotype. The diameter of the circle indicates the concentration of the clonotype. Persistent clonotypes are marked as colourful and bright circles, and a single colour represents one clonotype. Emerging clonotypes are uniformly marked as grey circles. For the representative patients in stages II–IV, the predominant high‐abundance clonotypes that existed before surgery remained predominant high‐abundance clonotypes after surgery, but their concentrations were reduced after surgery, especially in stage IV patients. (F) Concentration changes in persistent clonotypes in four representative patients before and after surgery. Each dot represents a persistent clonotype that is present in both pre‐ and post‐operative samples. Post‐ versus pre‐operative samples showing persistent clonotypes with decreased or increased abundance are marked as green and red dots, respectively, and stable persistent clonotypes are marked as blue dots. (G) The proportions of changes in persistent clonotypes post‐ versus pre‐operation. The proportions of decreased, increased, and stable clonotypes are marked with green, red, and blue bars, respectively. The order of patients is TR183, TR95, TR66, TR65, TR58, TR116, TR86, TR56, TR79, TR60, TR55, TR119, TR88, TR186, TR59, TR45, TR137, TR169, TR128, TR182, TR17, TRT141, TR16, TRPT180, TR6, TR23, TR184, TR22, TR70, TR102, TRML21, TR156, TR27, TR83, TR15, TR123, TR179, TR10, TR24, and TR63. The middle boxplot shows the ratio of the proportions of decreased and increased clonotypes in post‐operative samples in patients with different stages. The right boxplot shows the proportions of stable clonotypes in patients at different stages. The four representative patients are marked with rectangular frame. (H) Changes in the mean concentrations of persistent (left plot) and emerging (right plot) clonotypes before and after surgery in patients with different stages as determined by the paired Wilcoxon test.
