
Figure 2.
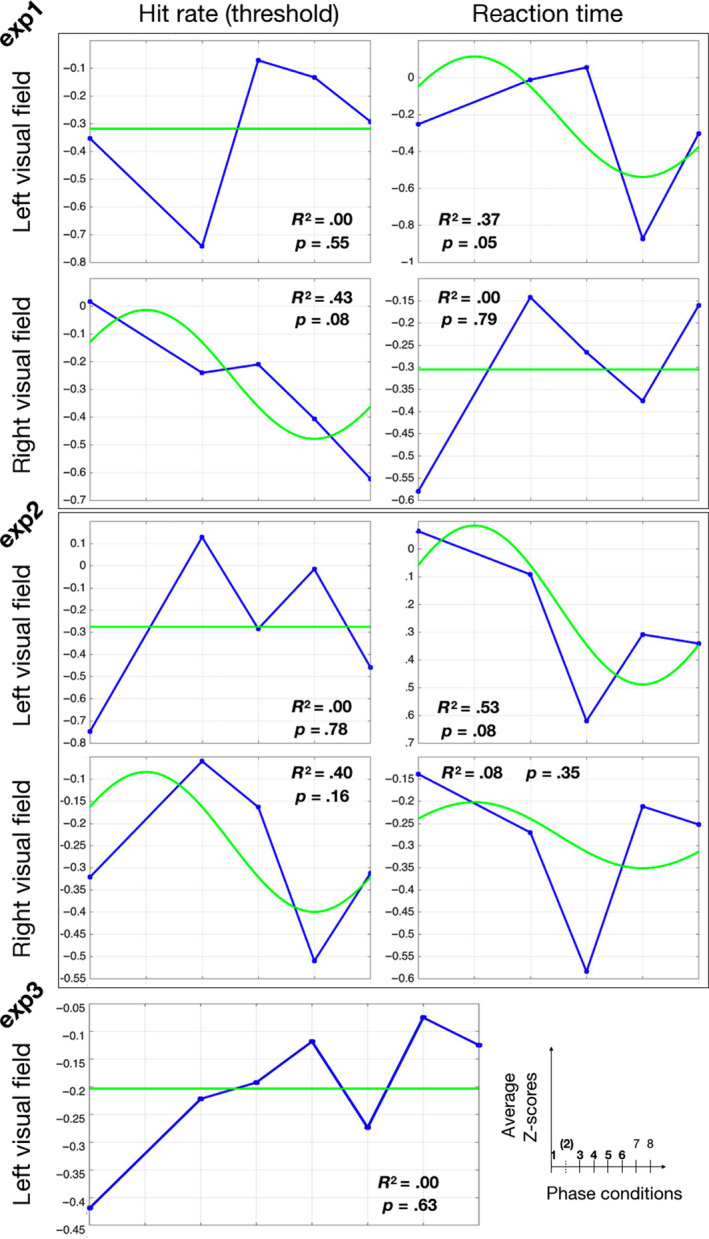
Phase‐aligned group average results. Individual observed results (contrast thresholds and mean RT in exp 1, accuracy and mean RT in exp 2, hit rate in exp 3) were Z‐scored, then phase‐shifted such that the absolute peak value was in phase slot “2” for each participant, then averaged across participants (blue lines). The group data point for phase slot “2” was left out of graphs and analysis, as it was an average of the individual datapoints used for phase alignment. tACS‐phase modulation of behavioral measures should result in a one‐cycle sinusoidal pattern over the remaining phase conditions, with its peak at phase slot 2. Thus phase‐locked best fitting sinusoids are shown in green. Above each graph, we present the goodness of fit of these sinusoidal fits, expressed by R‐squared (Rsq), and the p‐value to come out of a permutation test of the associated relevance value (a measure reflecting both the variance explained and the extent of modulation, see Methods) [Colour figure can be viewed at wileyonlinelibrary.com]