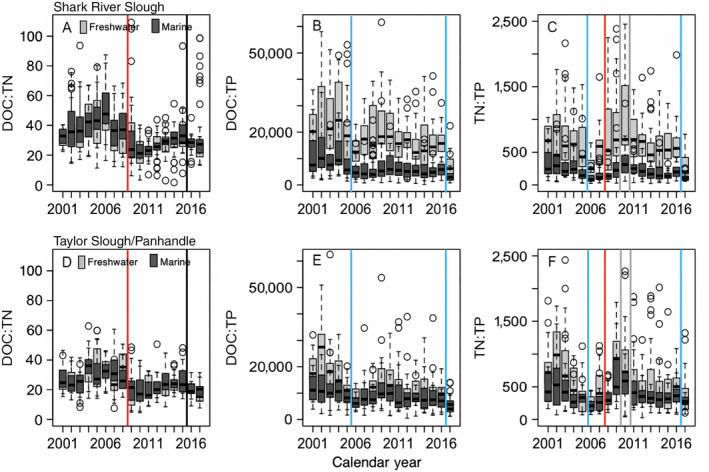
Figure 6.

Box and whisker plots of median (black line), upper and lower quartiles (box edges) of annual surface water dissolved organic carbon (DOC), total nitrogen, and total phosphorus molar ratios [(A,C) DOC:TN, (B,D) DOC:TP, (C,F) TN:TP] among freshwater (gray) and marine wetlands (dark gray) of Shark River Slough and Taylor Slough Panhandle from 2001 to 2017. Disturbances are indicated by black (droughts, flood), red (fire), blue (hurricanes), and gray lines (freeze events). Freshwater wetlands refer to marshes, and marine wetlands refer to mangroves. Whiskers represent the maximum and minimum values; open circles represent outlier values.
