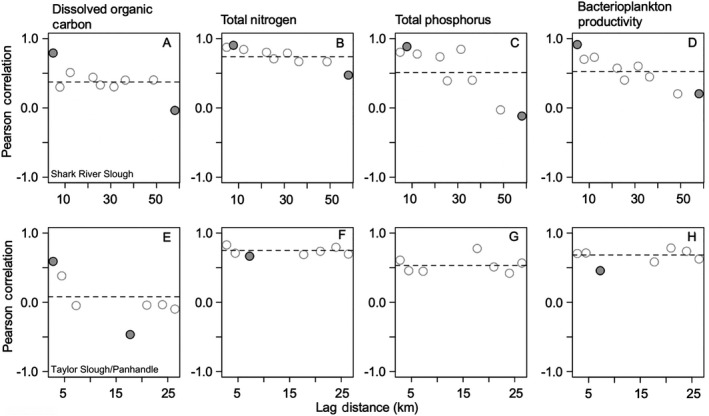
Figure 7.

Spatial and temporal synchrony of long‐term mean dissolved organic carbon, total nitrogen, and total phosphorus concentrations, and bacterioplankton productivity along the estuarine‐freshwater gradient of (A–D) Shark River Slough (SRS) and (E–H) Taylor Slough/Panhandle (TS/Ph) from 2001 to 2017. Positive and negative correlations with lag distance indicate relative synchrony or asynchrony, respectively. Horizontal dashes are mean values across spatial gradients of both SRS and TS/Ph transects. Solid circles denote significant (P < 0.05) departures from means.
