
Figure 3.
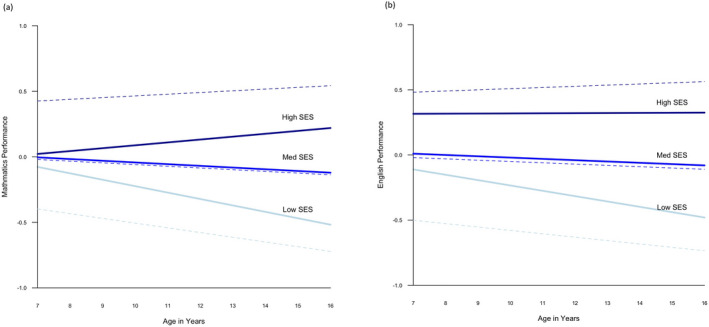
Performance trajectories for children from low, medium, and high socioeconomic status (SES) backgrounds, with and without adjusting for verbal and nonverbal ability. Trajectories in mathematics are shown in (a); trajectories in English are shown in (b).
Note. Low SES includes children, whose family SES is 1 SD below the mean (N = 170); medium SES includes children, whose family SES is between −1 and +1 SD (N = 488); and high SES includes children, whose family SES is 1 SD above the mean (N = 177). The dotted lines show education trajectories for each SES group without adjusting for verbal and nonverbal ability; the straight lines represent trajectories after adjusting for differences in verbal and nonverbal ability. [Color figure can be viewed at wileyonlinelibrary.com]