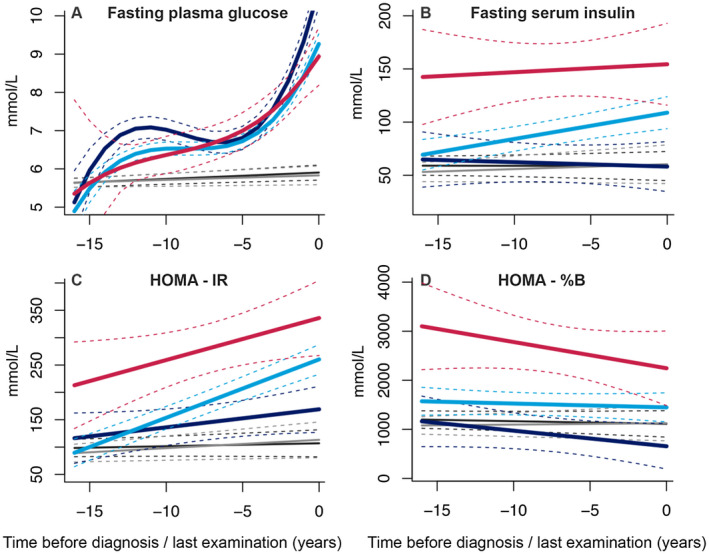
Figure 3.

Trajectories of fasting plasma glucose, insulin, and homeostatic model assessment‐insulin resistance (HOMA‐IR) and homeostatic model assessment‐ beta cell function (HOMA‐%B) during 14 years of follow‐up until diagnosis of type 2 diabetes, death, or censoring from the study. The figures represent a hypothetical man of 65 years old. Light blue, “progressive overweight” (including 85.1% of diabetes patients); red, “persistently high BMI” (4.4% of diabetes patients); dark blue, “progressive weight loss” (10.4% of diabetes patients); gray, “diabetes‐free”; black, “non‐ diabetes mortality.” [Color figure can be viewed at wileyonlinelibrary.com]
