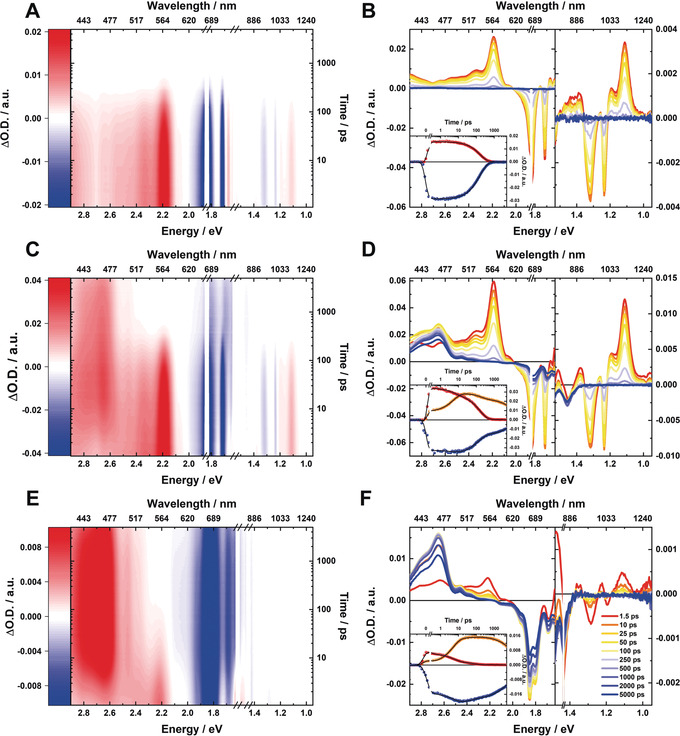
Figure 3.

Concentration and excitation dependency of 3 at cryogenic temperatures (80 K) A) Zero‐point‐ and chirp‐corrected fsTA heat map in the visible and near‐infrared part of the optical spectrum at low concentrations (5×10⁻⁶ m), obtained upon photoexcitation at 670 nm. B) Corresponding absorption–time profiles illustrating the excited‐state dynamics. The inset shows single‐wavelength kinetics at 575 (red) and 655 nm (blue) as well as global fit to data (black line). C) fsTA heat map established for increased concentrations (1×10⁻³ m) D) Corresponding absorption–time profiles illustrating the excited‐state dynamics. The inset shows single wavelength kinetics at 470 (orange), 560 (red), and 690 nm (blue) as well as global fit to data (black line). E) fsTA heat map obtained by change of the pump wavelength to 850 nm, corresponding to the characteristic absorption band maximum formed at high concentrations, that is, 1×10⁻³ m. F) Corresponding absorption–time profiles illustrating the excited‐state dynamics. The inset shows single‐wavelength kinetics at 470 (orange), 560 (red), and 690 nm (blue) as well as global fit to data (black line).
