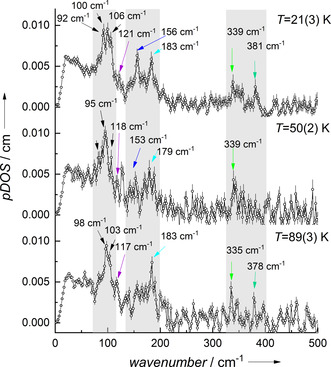
Figure 4.

161Dy‐pDOS of 1 recorded at indicated temperatures. The regions exhibiting the main vibrational bands are marked in gray. Several maxima are indicated with arrows in order to show the influence of the temperature change (see Figure S3 for enlarged view).
