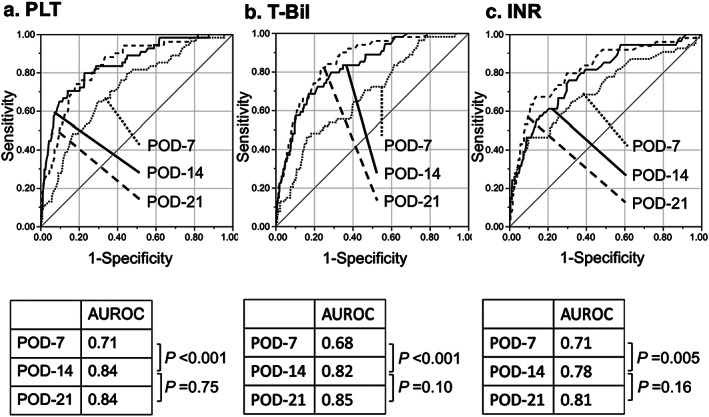
Figure 3.

Receiver operating characteristic (ROC) curves of platelet count (PLT), total bilirubin (T‐Bil), and prothrombin time – international normalized ratio (PT‐INR) in relation to recipient 6‐month survival following adult living‐donor liver transplantation. Predictive power analyses using area under the ROC curves (AUROCs) of (a) PLT, (b) T‐Bil, and (c) PT‐INR for recipient 6‐month survival. AUROCs were 0.84 (95% confidence interval [CI], 0.78–0.89), 0.82 (0.76–0.87), and 0.78 (0.71–0.84), respectively, all of which were significantly higher than those on postoperative day (POD)‐7, but not significantly different from those on POD‐21 by DeLong tests. P‐values <0.05 were regarded as statistically significant.
