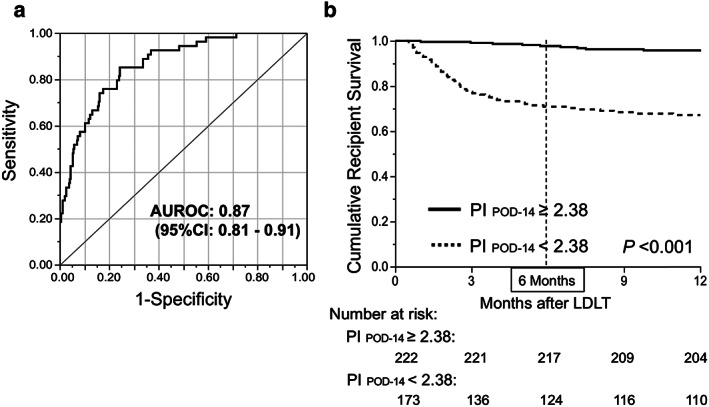
Figure 4.

Prognostic index (PI) by platelet count (PLT), total bilirubin (T‐Bil), and prothrombin time – international normalized ratio (PT‐INR) on postoperative day (POD)‐14 following adult living‐donor liver transplantation (LDLT). (a) Logistic regression analysis provided the following formula: PI POD‐14 = 3.39 + 0.12 × (PLT POD‐14) – 0.09 × (T‐Bil POD‐14) − 1.23 × (INR POD‐14). Area under the receiver operating characteristic (ROC) curve (AUROC) of this formula for predicting recipient 6‐month mortality was 0.87 (95% confidence interval, 0.81–0.91). (b) Cut‐off value of PI, 2.38, was determined based on sensitivity of 90.7% (specificity, 63.9%) in the ROC curve. Recipient survival proportion within 6 months in the low‐risk group (≥2.38, n = 222; solid line) was significantly higher than that in the high‐risk group (<2.38, n = 17; dotted line). Survival gap between the curves widened during the first 6 months after LDLT, and became parallel with each other (almost plateau) thereafter. Survival rates were estimated with the Kaplan–Meier method followed by the log–rank test. P‐values <0.05 were regarded as statistically significant.
